Plotting TGraphs on the same graph

Dear all,

I want to plot two graphs on the same plot. I have used this but its not plotting.

                                TGraph *gr1  = new TGraph(n,x1,y1);
                               TGraph *gr2  = new TGraph(n,x2,y2);
                               gr2->SetMarkerColor(2);
                               //gr2->SetMarkerStyle(21);

                               // create a multigraph and draw it
                               TMultiGraph  *mg  = new TMultiGraph();
                               mg->Add(gr1);
                               mg->Add(gr2);
                               mg->Draw("AP*");

so I used this option but it plots only one of the graphs.

 c2->cd(1);
                                // create the 1st TGraph
                               TGraph *gr1 = new TGraph(n,x1,y1);
                              // gr1->Draw("AP*");

                               // create the 2nd TGraph
                               TGraph *gr2 = new TGraph(n,x2,y2);
                               gr2->SetMarkerColor(2);
                               //gr2->Draw("AP*");


                               gr1->Draw("A*");
                               gr2->Draw("A*");

what should I do for two graphs to be on the same graph?

This should work. Can you post a macro we can run? (the vectors are not defined in your code example).

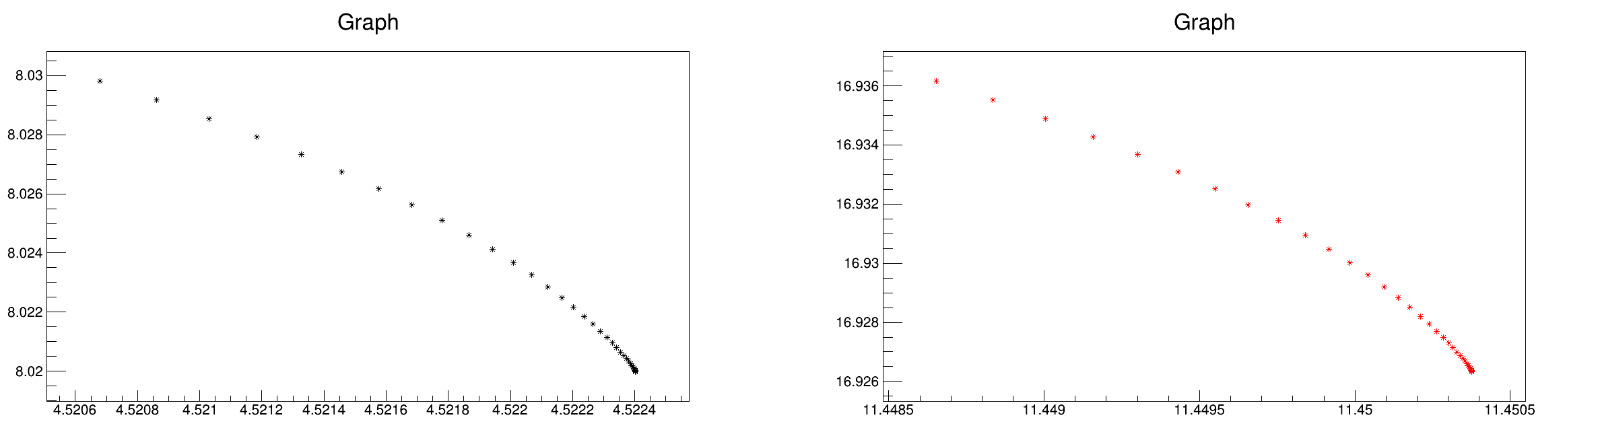
yes please I tried this one as well but it didnt work. My macro uses a big data file in order for it to run that I cannot upload here. the thing is the two data has different axis as well. I do not know if I can upload image here for you to see that two graphs seperately

A TMultiGraph should automatically compute the X and Y axis ranges to make all data points visible.

Another approach (not using a TMultiGraph):

{
   const int n = 10;
   double x1[n] = {0,1,2,3,4,5,6,7,8,9};
   double x2[n] = {0,-1,-2,-3,-4,-5,-6,-7,-8,-9};
   double y1[n] = {1,2,3,4,5,5,4,3,2,1};
   double y2[n] = {5,4,3,2,1,1,2,3,4,5};
   auto gr1  = new TGraph(n,x1,y1);
   gr1->SetMarkerColor(3);
   gr1->SetMarkerStyle(20);
   auto gr2  = new TGraph(n,x2,y2);
   gr2->SetMarkerColor(2);
   gr2->SetMarkerStyle(21);

   auto mg  = new TMultiGraph();
   mg->Add(gr1);
   mg->Add(gr2);
   mg->Draw("AP");
}

okay thank you it worked

thank you all it worked now

apparently, my supervisor does not the superimpose graph. We are looking for something like this

and the two graphs plotted on seperate graphs is this.

mg->Draw("APC");

In that case, you should divide your canvas in 2 subpad using Divide and draw each graph on a diffirend pad using cd. Do you know how or do you want an example?

yes please I want an example

TCanvas *c = new TCanvas("c", "c");
c->Divide(1, 2); // (1, 2) ... or ... (2, 1)
c->cd(1); gr1->Draw("APC");
c->cd(2); gr2->Draw("APC");
c->cd(0);