Hello,
I’m new in the ROOT community!
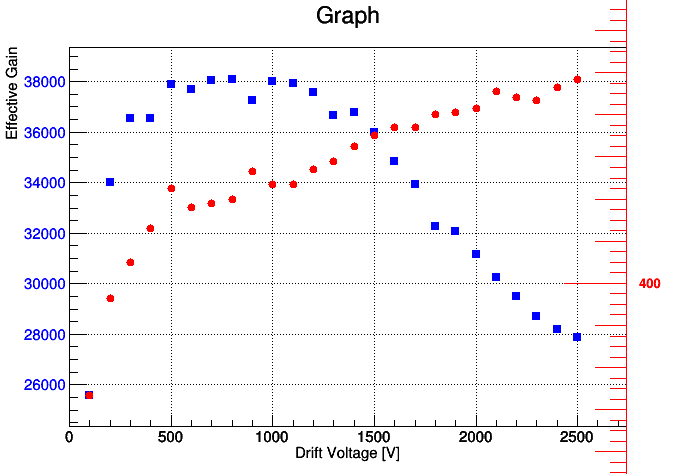
…looking to the example of macro illustrating how to superimpose two histograms I was able to superimpose two TGraphs with different ranges and to draw a new Yaxis for the second one (see the png file attached).
Now I would like to change:
the plotTitle
the color of the left axis title
and add the axis title on the right (I was trying to do with SetTitle(“Rates [Hz]”) but it doesn’t work)
Thank you very much Pepe for the advice
It works!
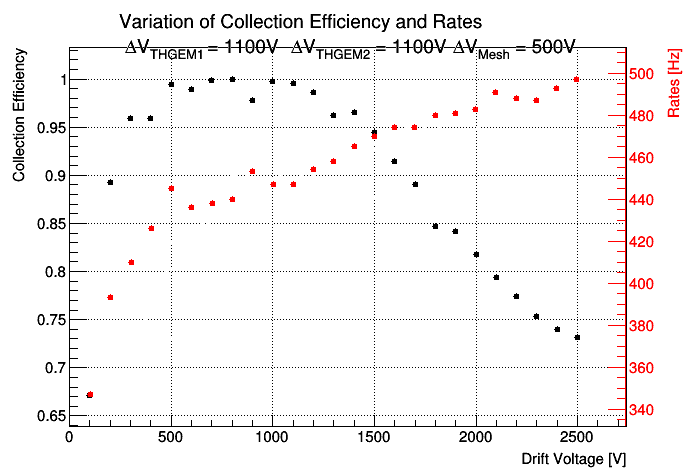
The only thing I would like to change now is the Title on the top.
as now I’m using the command
g1->SetTitle("#splitline{Variation of Collection Efficiency and Rates}{ #DeltaV_{THGEM1} = 1100V #DeltaV_{THGEM2} = 1100V #DeltaV_{Mesh} = 500V}; Drift Voltage [V];Collection Efficiency");
which is setting the top title, the Xaxis title and the Yaxis title for the first TGraph, how can I select in this case only the top title? Is it possible somehow to set an offset on it with a command like