I have been trying to plot the sum of individual extended pdfs, where the fit has converged successfully, and the individual pdfs also give a nice plot on their separate datasets, but during plotting I am unable to get a clear plot. log.txt (256.9 KB)
please find the attached log file below, and the images below, and the minimal code minimal_code.txt (952 Bytes)
@jonas is very busy in the last two weeks, so let me ask what you want to do. I’m not sure what “during plotting I am unable to get a clear plot” means.
I see that you successfully created some plots, but I don’t understand what’s missing to complete the task. Could you try to explain again in different words?
@StephanH
Thank you for the reply.
Here what I am trying to say is I am trying to overlay and plot the sum of 2 extended pdfs, for B0 and B0bar over their combined datasets using
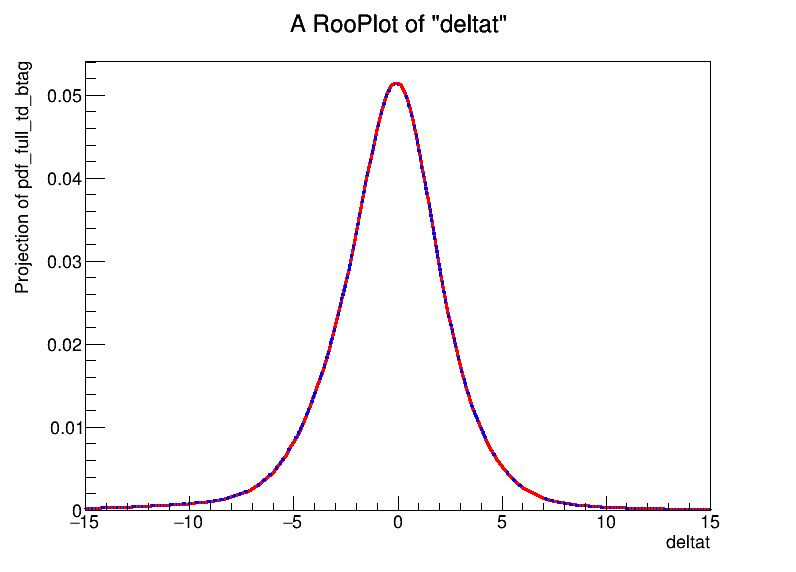
Now, if I plot only the pds[0,1] I get the first plot.
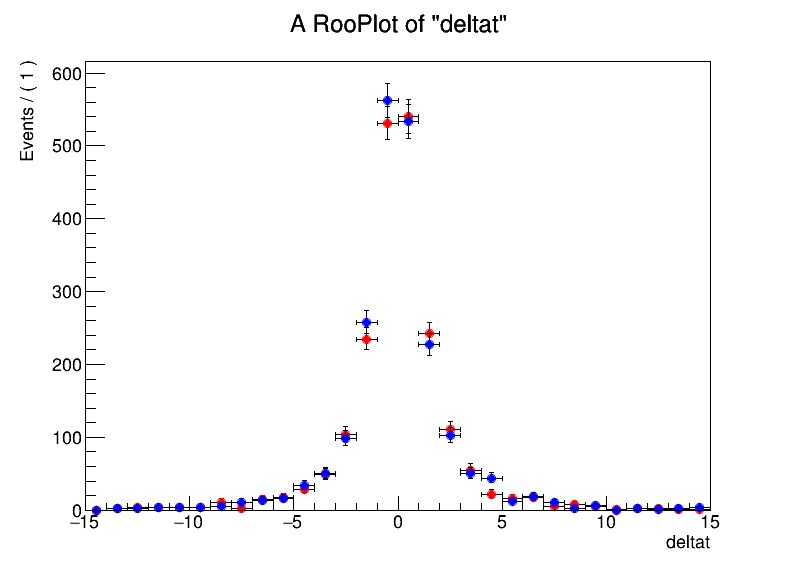
If I plot only the datasets[0,1], I get the second plot.
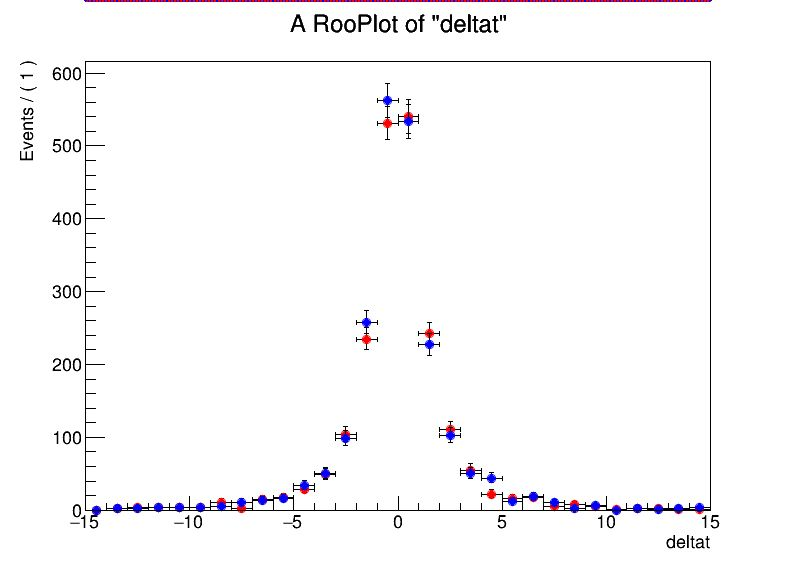
But if I plot them together, I get the error(in the .zip file, along with the minimal example) and the 3rd plot, even though the fit has converged and matrix is fully accurate!
So, I am guessing it is a plotting issue with roofit
Also, i tried plotting the signal and background only pdfs on their respective datsets, and they are fine (not shown here).
OK, I see now what you mean. To normalise the PDFs to the data in the plots, RooFit needs to integrate them. It looks like in doing that, it reached an unphysical region where the PDF is not defined, and therefore results in not-a-number.
Could it be that choosing a different range for deltat helps? Or is one of the parameters in an invalid region? You can try to evaluate the PDF before plotting it, or you can try to print it using Print(“V”) or Print(“t”) to see what’s going on.
Hello,
deltat being 0 currently, and having a range from -15 to 15 look fine. The question is if the PDF is well-defined on that entire range for the current values of the parameters. When it’s integrated (numerically), the integrator will test several points in that range. So if for some parameter values and some value of deltat the PDF is ill-defined, the integral cannot be performed.
Did you also try the tree printing? If I’m not mistaken, this also prints the current values.
See for example the roofit 206 tutorial. When you print the expression as a tree, you can see the values of the sub-expressions. We need to check if one of them is ill-defined for the values that the integrator was evaluating.
OK, we are one step closer to the solution, but it’s not yet the solution:
In this snippet, only the integrals are nan, but we already knew that. The PDFs seem to be OK. But it looks like when passing one of the deltat values from the range [-15,15], the PDFs might be ill-defined. Could you check manually, by setting deltat to a few values and evaluating the PDFs?
This could show which sub-expression of those PDFs is ill-defined.
import numpy as np

deltat      = reso_ws.var("deltat")
deltaterr   = reso_ws.var("deltaterr")
r           = reso_ws.var("r")
mod_mbc     = reso_ws.var("mod_mbc")
csobdtprime = reso_ws.var("csobdtprime")
deltae      = reso_ws.var("deltae")

pdf = reso_ws.pdf("pdf_full_td_btag")

with open("scan_log.txt", "w") as logfile:
    scan_vals = np.linspace(-15, 15, 300)
    for val in scan_vals:
        deltat.setVal(val)
        y = pdf.getVal(R.RooArgSet(deltat, deltaterr, r, mod_mbc, csobdtprime, deltae))
        if not np.isfinite(y):
            logfile.write(f"WARNING: NaN or Inf at deltat = {val}\n")
and it seems like it fails for all values of deltat !
WARNING: NaN or Inf at deltat = -15.0
WARNING: NaN or Inf at deltat = -14.899665551839465.
.
.
.
WARNING: NaN or Inf at deltat = 14.899665551839465
WARNING: NaN or Inf at deltat = 15.0
That’s because getVal(setToNormaliseOver) still has to run the integral, so you will get the NaNs during the integration.
Try getVal(), because this doesn’t normalise (i.e. integrate).
Hmm, that’s interesting. I think this is the point where we need an example that can be run. Can you share a code snippet that declares the PDF that’s used in the fit?
We don’t need any data to test it.
Edit: I see that you attached it in a zip file. We will have a look at it next week, since @jonas is not available today.