Dear experts,
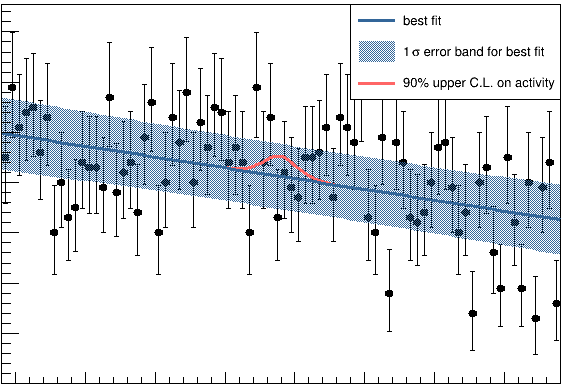
I have been working on a plot where I want to display the background pdf of my model and its 1sigma error band as well as a curve with an artificial signal. I have been facing two different problems (see in the figure attached):
- The background and signal curve do not have the same normalization: the bigger the signal, the lower the signal curve lies. I would expect the signal curve to be in the same position as the background curve.
- The error band of the background curve seems to be zero where the signal would be expected. I would expect the error band to have at least some width at that position.
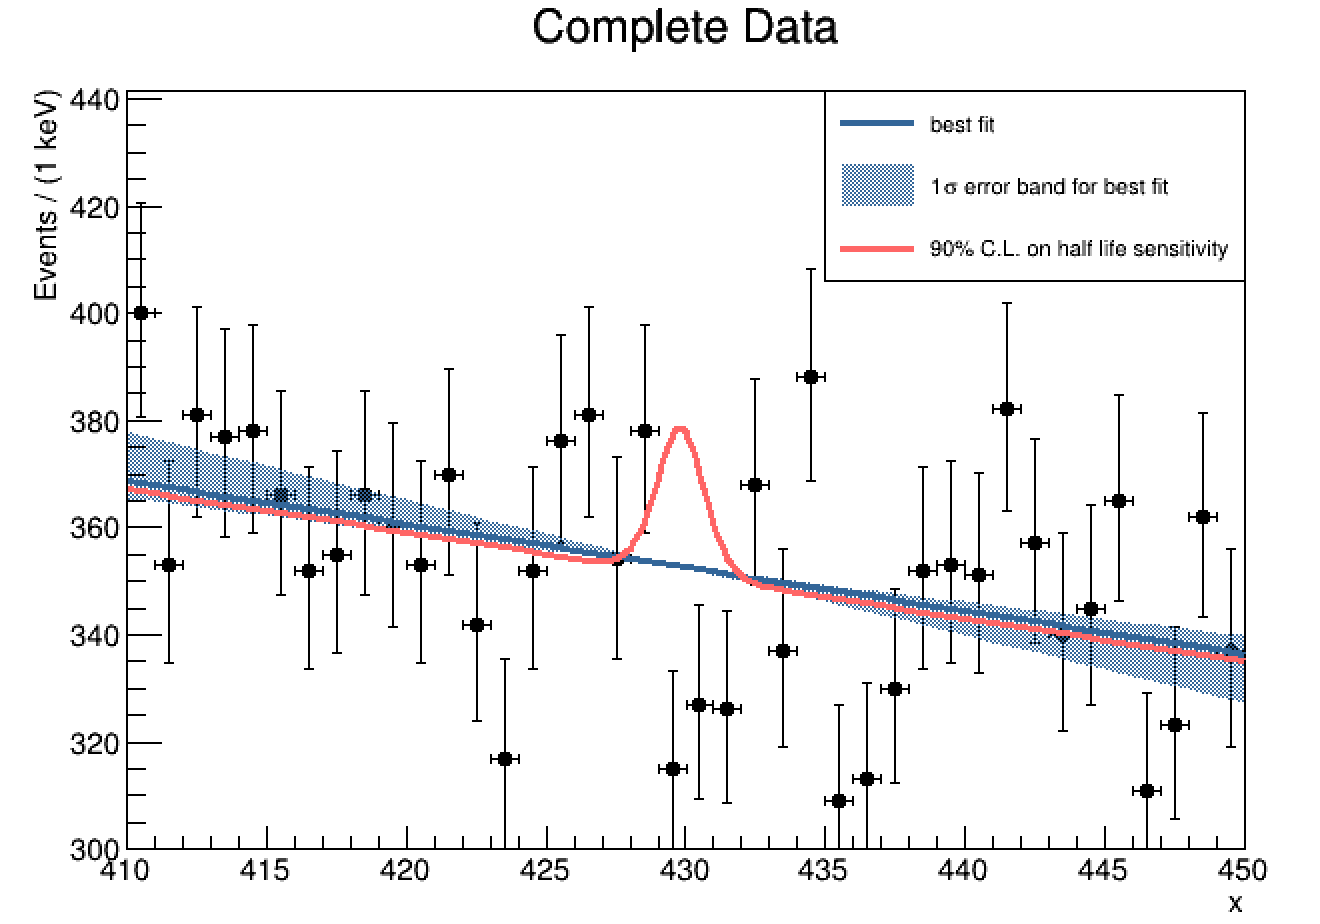
Here is an example of what I would rather like to achieve:
I’m attaching the dummy code that leads to the initial result:
sinal_plot_dummy.C (8.8 KB)
Thank you very much in advance for trying to help!