Hello,
I have this profile likelihood ratio plot as shown in figure 1 below. And i want to draw 1, 2 and 3 sigma lines on it as shown in the figure 2. I am using ProfileLikelihoodCalculator.C file.
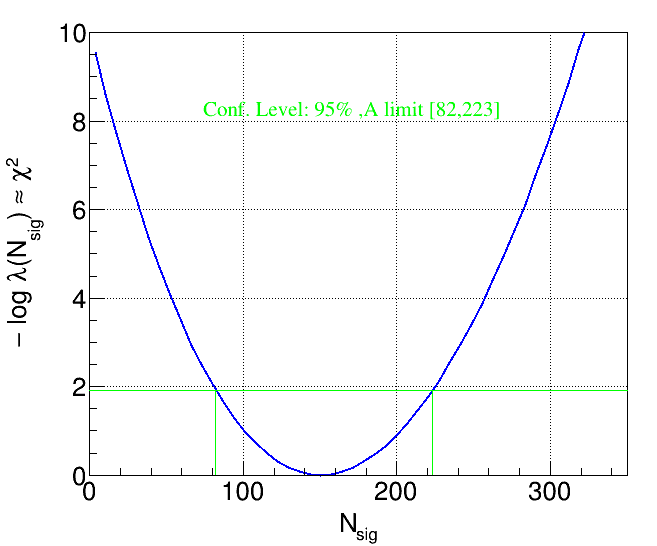
Figure 1
Could someone tell me how could one do that? Here is my code:
Thanks!
What is your problem ? finding the lines coordinates or drawing the lines ?
Drawing the lines. Now i am thinking i can only draw horizontal lines to show 2 and 3 sigma lines.
If you know the line coordinates simply use TLine to draw them.
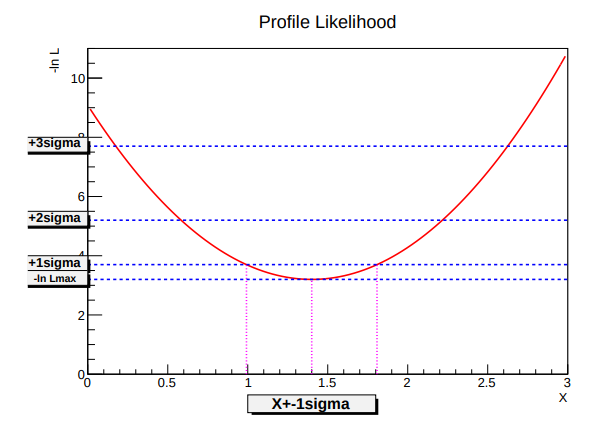 Figure 1