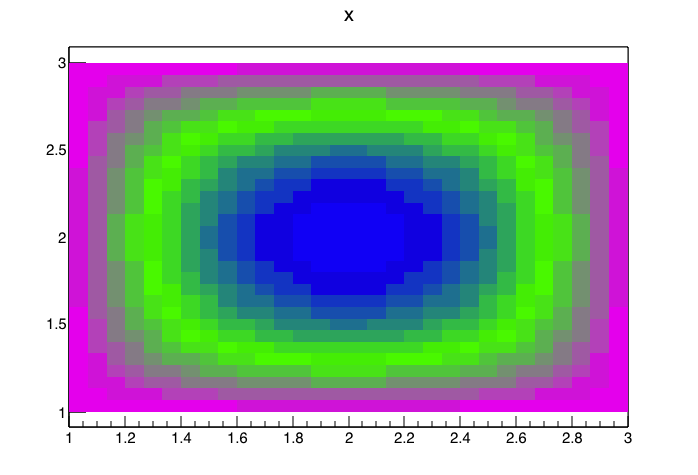
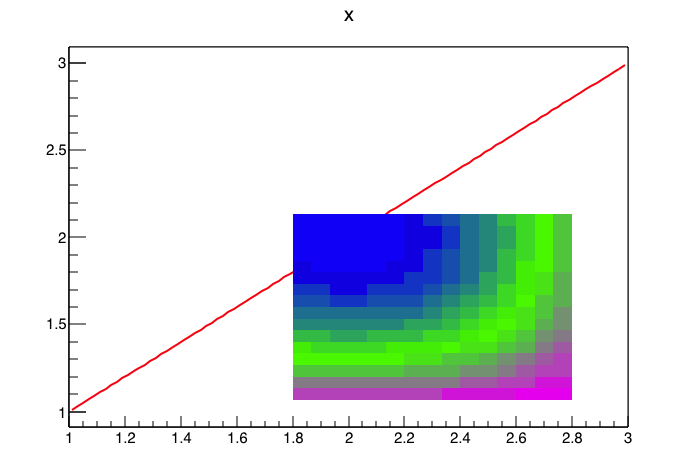
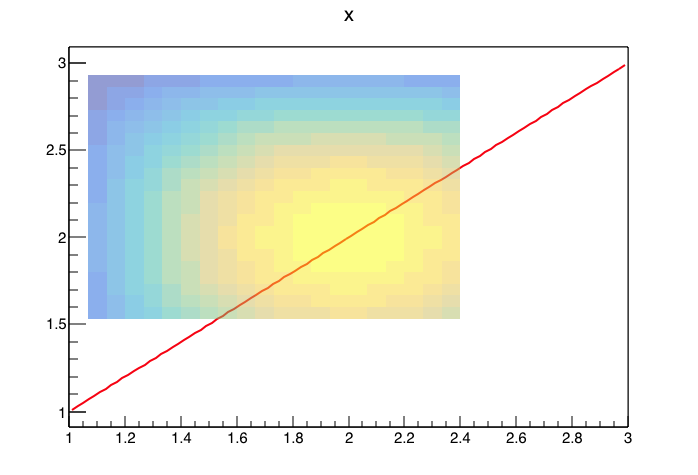
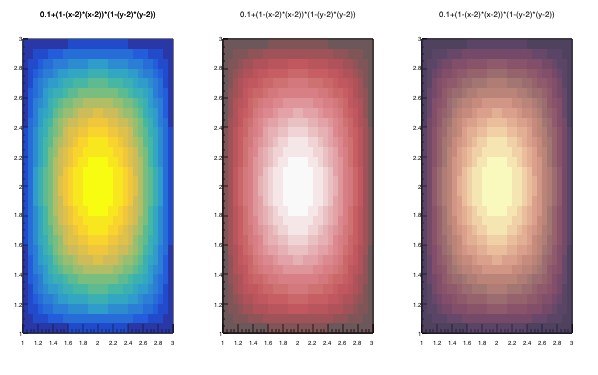
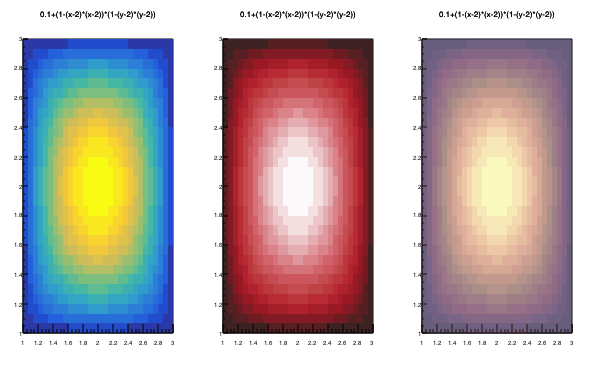
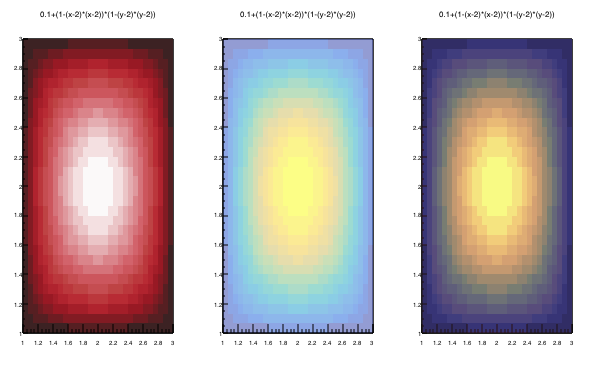
I would like to superimpose two 2D histograms plotted with option “col” and two different palettes and each plot with certain degree of transparency. I tried to do it with the example in multipalette.C, by adding transparency in the definition of the palettes. It did not work for me. I am attaching the modified example. Any help would be appreciated.
/// \file
/// \ingroup tutorial_graphs
/// \notebook
/// Draw color plots using different color palettes.
///
/// \macro_image
/// \macro_code
///
/// \author Olivier Couet
#include "TStyle.h"
#include "TColor.h"
#include "TF2.h"
#include "TExec.h"
#include "TCanvas.h"
void Pal1()
{
static Int_t colors[50];
static Bool_t initialized = kFALSE;
Double_t Red[3] = { 1.00, 0.00, 0.00};
Double_t Green[3] = { 0.00, 1.00, 0.00};
Double_t Blue[3] = { 1.00, 0.00, 1.00};
Double_t Length[3] = { 0.00, 0.50, 1.00 };
if(!initialized){
Int_t FI = TColor::CreateGradientColorTable(3,Length,Red,Green,Blue,50);
for (int i=0; i<50; i++) colors[i] = FI+i;
initialized = kTRUE;
return;
}
gStyle->SetPalette(50,colors,0.0);
}
void Pal2()
{
static Int_t colors[50];
static Bool_t initialized = kFALSE;
Double_t Red[3] = { 1.00, 0.50, 0.00};
Double_t Green[3] = { 0.50, 0.00, 1.00};
Double_t Blue[3] = { 1.00, 0.00, 0.50};
Double_t Length[3] = { 0.00, 0.50, 1.00 };
if(!initialized){
Int_t FI = TColor::CreateGradientColorTable(3,Length,Red,Green,Blue,50);
for (int i=0; i<50; i++) colors[i] = FI+i;
initialized = kTRUE;
return;
}
gStyle->SetPalette(50,colors,0.);
}
TCanvas *multiPaletteTransparency() {
TCanvas *c3 = new TCanvas("c3","C3",0,0,600,400);
gStyle->SetCanvasPreferGL(kTRUE);
c3->Divide(2,1);
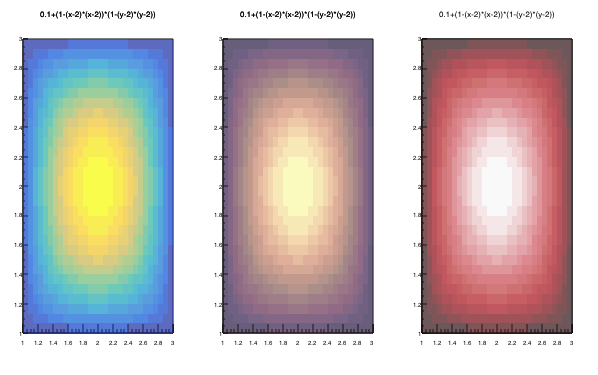
TF2 *f3 = new TF2("f3","0.1+(1-(x-2)*(x-2))*(1-(y-2)*(y-2))",1,3,1,3);
f3->SetLineWidth(1);
f3->SetLineColor(kBlack);
c3->cd(1);
f3->Draw("col");
TExec *ex1 = new TExec("ex1","Pal1();");
ex1->Draw();
f3->Draw("col");
f3->Draw("col same");
c3->cd(2);
f3->Draw("col");
TExec *ex2 = new TExec("ex2","Pal2();");
ex2->Draw();
f3->Draw("col same");
return c3;
}