On what OS are you running? None of the examples sent work for me.
Mac. Try to change the system.rootrc file instead of setting PreferGl in the macro (see TColor doc);
Does this one work for you:
Got it. I changed the system.rootrc file and now it works for your
example. Still the custom palette remains.
Thanks,
Pablo
Back to the initial question, I confirm that via SetPalette the alpha parameter is taken into account only for predefined palettes (may be the doc will need to be clarified there) . For the user defined palettes it is up to the user to put transparent colors in the palette. With the code you wrote you can do it with the last parameter of CreateGradientColorTable
   if(!initialized){
      Int_t FI = TColor::CreateGradientColorTable(3,Length,Red,Green,Blue,50, 0.5);
      for (int i=0; i<50; i++) colors[i] = FI+i;
      initialized = kTRUE;
   }
   gStyle->SetPalette(50,colors);
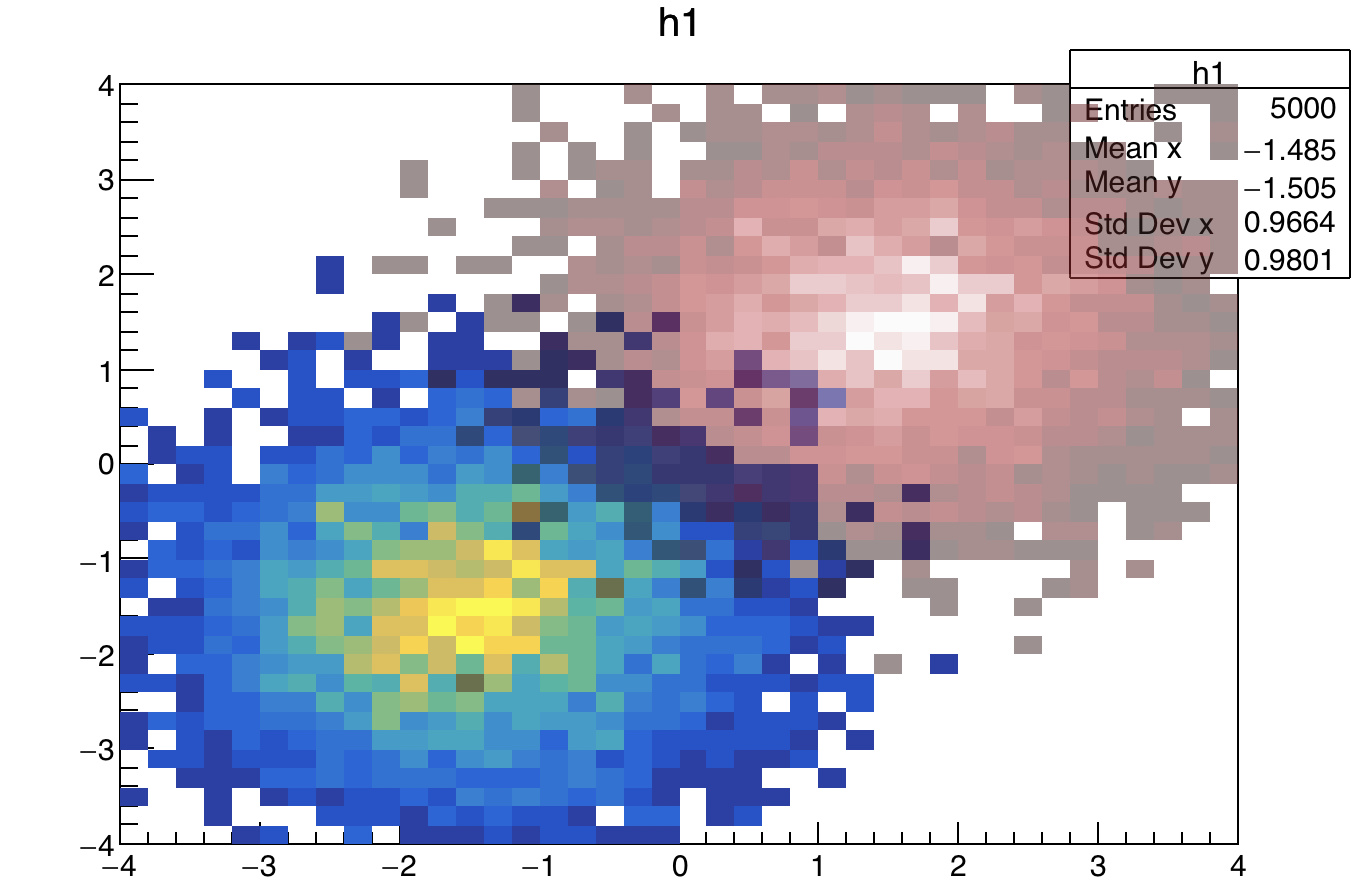
But, still that it is not what I would like to do. I would to
superimposed two different 2d histos with different palettes. You are
just plotting one histogram with a mixture of palettes.
{
   TCanvas *c1 = new TCanvas("c1");

   TH2F *h1 = new TH2F("h1","h1",40,-4,4,40,-4,4);
   TH2F *h2 = new TH2F("h2","h2",40,-4,4,40,-4,4);
   Double_t a,b;
   for (Int_t i=0;i<5000;i++) {
      gRandom->Rannor(a,b);
      h1->Fill(a-1.5,b-1.5);
      h2->Fill(a+1.5,b+1.5);
   }
   TExec *ex1 = new TExec("ex1","gStyle->SetPalette(kBird);");
   TExec *ex2 = new TExec("ex2","gStyle->SetPalette(kCherry,0,0.5);");
   h1->Draw("col");
   ex1->Draw();
   h1->Draw("col same");
   ex2->Draw();
   h2->Draw("col same");
}
I am almost there. Actually, it looks like I can use a couple of
predefined palettes. However, I have one more problem.
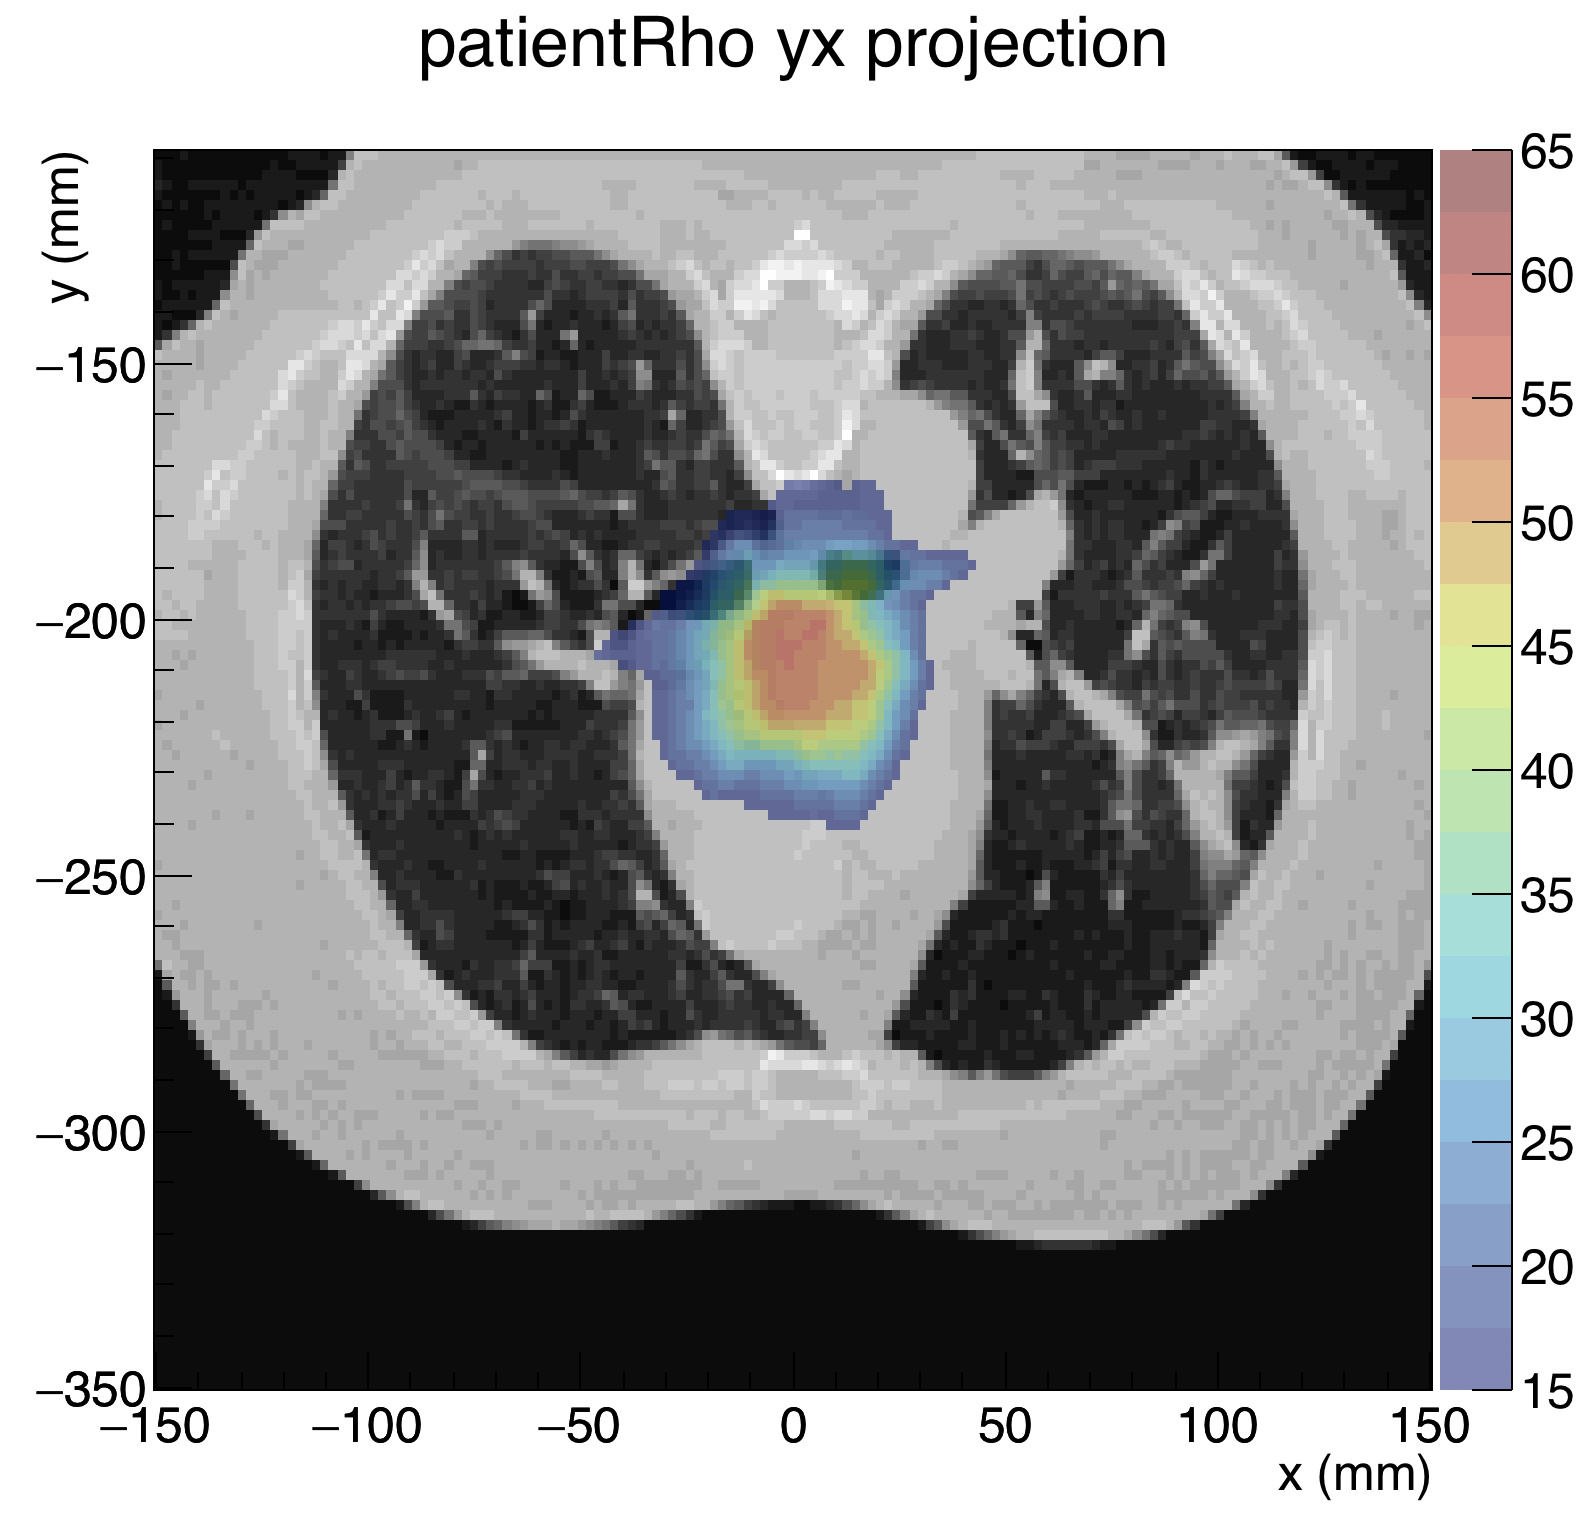
Look at the attached macro. You will also need the attached input file.
Notice that the color scale for h2 on panel 1 is not right. The right
scale is shown on panel two where h2 is plotted alone.
I also need to flip the y axis of the histograms. I would like to show
the -350 at the top and -150 at the bottom. Is there a quick way to do that?
Thank you,
Pablo
test3.cxx (555 Bytes)
example-figures.root (177 KB)
The attache macro gives the following plot. The problem with you version was that when an histogram ins drawn with the option SAME it uses the ranges defined by the previously drawn histogram on X Y et Z axis. To workaround this you need to draw the 2nd histogram in a transparent pad overplayed on the already drawn histogram. That’s what the attached macro does .
yepes2.C (808 Bytes)
There is no easy way to do that. The example ROOT: tutorials/hist/reverseaxis.C File Reference shows how to do it. But be careful that it simply draws the axis upside down ! you will need to make a new histogram mirroring the bins.
One side comment:
Even if ROOT provides the RainBow color map, it is not a recommended palette to visualise data, as explained in this article.
The attached macro draws the reversed axis. Still the bins of the histograms
need to be reversed too
yepes2.C (2.0 KB)
Actually, I just need to reverse the bins, and get rid of the axis in
the final plot.
Is it possible to define histograms with axis going from Xmin to Xmax,
where Xmin>Xmax? That would solve the problem.
Some time ago, I Google around about it, and my conclusion was that it
was not possible, even though some people seemed to have asked about it.
Thanks a lot for all your help,
Pablo
No it is not possible because ROOT initially comes from a High Energy physics where we do not need this kind of histograms. But if you do not need the axis it is simpler: you can just make new histograms from the one have. You loop of the bins and fill the new ones reverse and at display time you simpler set axis parameters such a way they are not shown.
How difficult would be to implement that? It looks like ROOT has gone
beyond the frontiers of HEP, and it would be a great addition that would
greatly simplify some people’s lives…
Thanks again,
Pablo
It is a simple loop getting the content of one histogram and filling a new one (GetBinContent and SetBinContent). We have no plans to include that in ROOT as @moneta, who is in charge of the histogramming package, told me.
Believe me, it would make my life much simpler. I have cases of three
dimensional cubes (CTs) where the axis go from positive to negative. We
use TH3F to handle them and it works well for regular axes. I am
thinking we could write a class on top of TH3F to handle the issue.
In any case, thank you for all your help, it has been very useful.
Pablo Yepes
I let @moneta comment about the possibility of having this in ROOT. May be you can submit some implementation ?
Good I was of some help 
Note that, in ROOT, cases when “xmax <= xmin” have usually special meanings. So, I think it will break “backwards compatibility” if you allow histograms with “reversed axes” now.
I think, there need to be new “drawing / painting options” introduced, which will “reverse” axes just in the canvas (without touching the histogram).
Wile,
This is not really a priority for me. I may give a try, if I find
some time to work on it. I’ll keep you posted if I get around to it.
Thanks,
Pablo