The code is relatively short so I’ll paste it here and that should solve the issue:
import ROOT
B_M = ROOT.RooRealVar("B_M","m[GeV/c^{2}]",2.5,6)
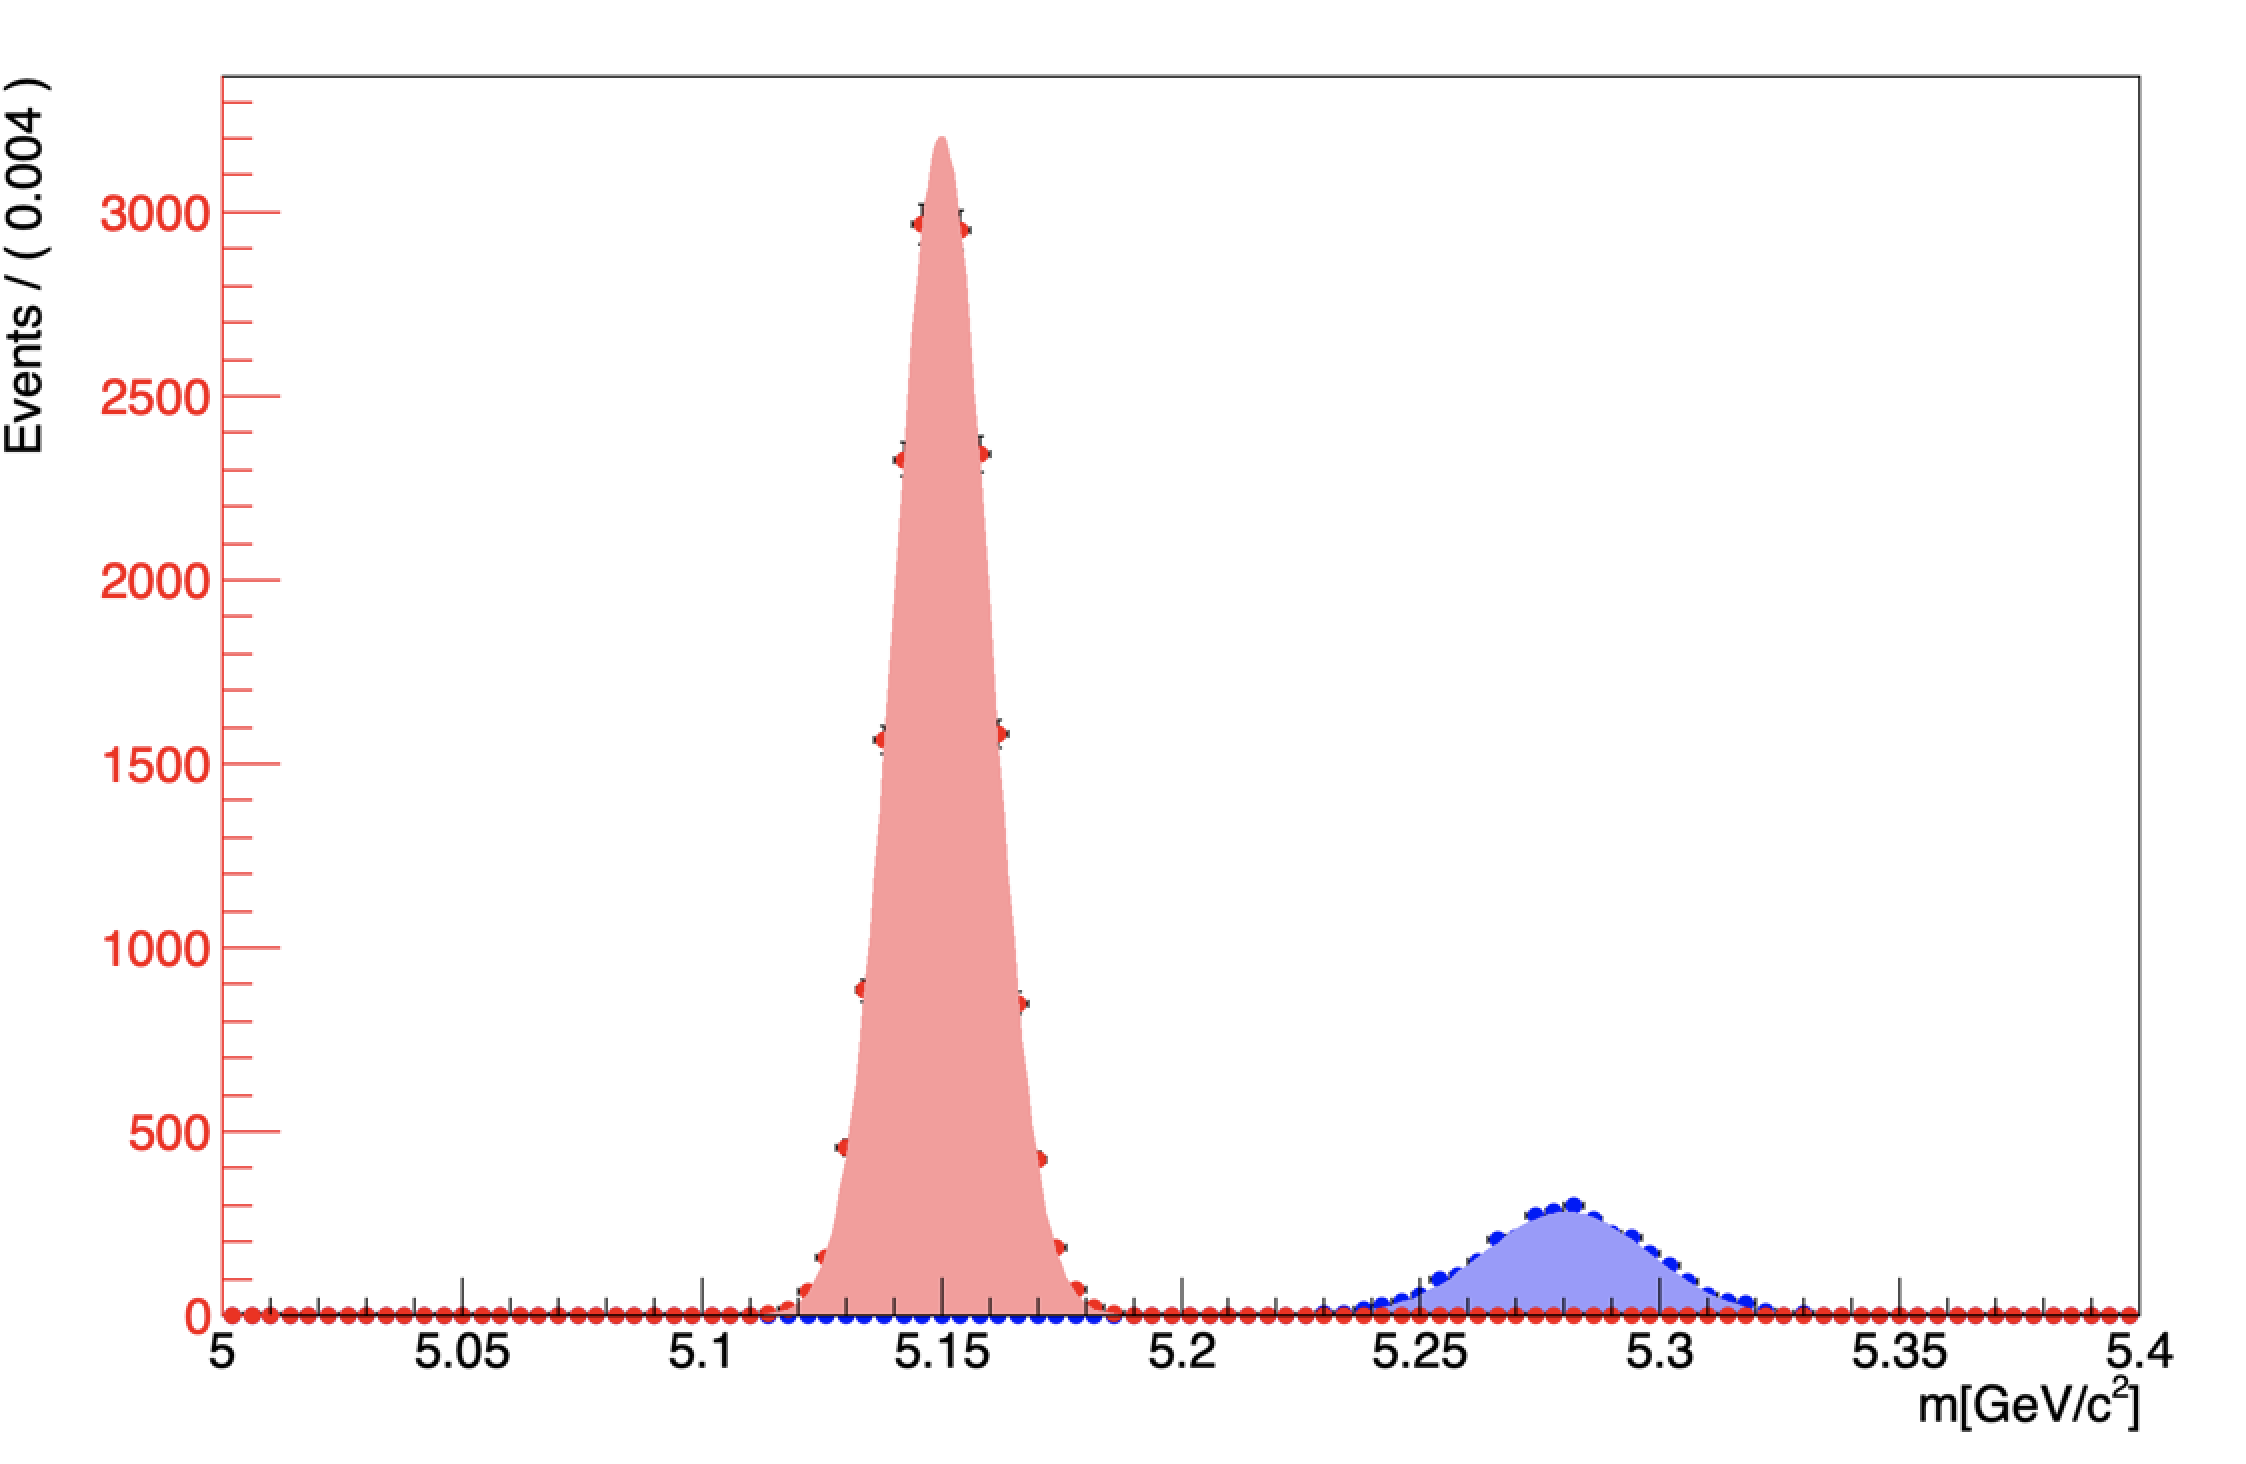
meanBdKst = ROOT.RooRealVar("meanBdKst", "mean of BdKst", 5.28, 5.1, 5.4)
sigmaBdKst = ROOT.RooRealVar("sigma1BdKst", "width of BdKst", 0.017, 0.01, 0.03)
meanBdrho = ROOT.RooRealVar("meanBdrho", "mean of Bdrho", 5.15, 5.1, 5.4)
sigma1Bdrho = ROOT.RooRealVar("sigma1Bdrho", "width of Bdrho", 0.01, 0.005, 0.02)
# Making gaussians :
fitBdKst = ROOT.RooGaussian("fitBdKst","Fit du M Substitué",B_M, meanBdKst, sigmaBdKst)
fitBdrho = ROOT.RooGaussian("fitBdrho", "Signal Bdrho", B_M, meanBdrho, sigma1Bdrho)
# Generating data:
dataBdKst = fitBdKst.generate(ROOT.RooArgSet(B_M), 3000)
dataBdrho = fitBdrho.generate(ROOT.RooArgSet(B_M), 20000)
# Fitting gaussians:
fitBdKst.fitTo(dataBdKst)
fitBdrho.fitTo(dataBdrho)
# Plot :
framedata = B_M.frame(ROOT.RooFit.Title("B^{0} -> #rho #mu #mu + 5% B^{0} -> K #pi #mu #mu "), ROOT.RooFit.Range(5, 5.4))
dataBdKst.plotOn(framedata, ROOT.RooFit.MarkerColor(ROOT.kBlue), ROOT.RooFit.Name("dataBdKst"))
fitBdKst.plotOn(framedata, ROOT.RooFit.LineColor(ROOT.kBlack), ROOT.RooFit.LineWidth(1), ROOT.RooFit.MoveToBack())
fitBdKst.plotOn(framedata, ROOT.RooFit.LineColor(ROOT.kBlack), ROOT.RooFit.DrawOption("F"), ROOT.RooFit.FillColor(ROOT.kBlue-9), ROOT.RooFit.Name("fitBdKst"), ROOT.RooFit.MoveToBack())
dataBdrho.plotOn(framedata, ROOT.RooFit.MarkerColor(ROOT.kRed), ROOT.RooFit.Name("dataBdrho"))
fitBdrho.plotOn(framedata, ROOT.RooFit.LineColor(ROOT.kBlack), ROOT.RooFit.LineWidth(1), ROOT.RooFit.MoveToBack())
fitBdrho.plotOn(framedata, ROOT.RooFit.LineColor(ROOT.kBlack), ROOT.RooFit.DrawOption("F"), ROOT.RooFit.FillColor(ROOT.kRed-9), ROOT.RooFit.Name("fitBdrho"), ROOT.RooFit.MoveToBack())
DataBdrho = framedata.findObject("dataBdrho")
DataBdKst = framedata.findObject("dataBdKst")
FitBdrho = framedata.findObject("fitBdrho")
FitBdKst = framedata.findObject("fitBdKst")
Frame = ROOT.TCanvas("Bdrho+0.05Kst", "Bdrho+0.05Kst", 1200, 800)
framedata.SetAxisColor(color=ROOT.kRed, axis="Y")
framedata.SetLabelColor(color=ROOT.kRed, axis="Y")
framedata.Draw()
l = ROOT.TLegend(0.7, 0.7, 0.88, 0.88)
l.AddEntry(DataBdrho, "Data B^{0} -> #rho #mu #mu", "pe" )
l.AddEntry(DataBdKst, "Data B^{0} -> K^{*0} #mu #mu", "pe" )
l.AddEntry(FitBdrho, "Fit B^{0} -> #rho #mu #mu", "f" )
l.AddEntry(FitBdKst, "Fit B^{0} -> K^{*0} #mu #mu", "f" )
l.SetBorderSize(0)
l.Draw()
Sorry for the inconvenience and thanks again !