Logistic function fit

Hi @couet thank you. This is the plot about covid-19 made by civil protection (just data, without the fit)


On x-axis they write the day. I’d like to write da day too. Then, I should replace 1 with 24/02, 2 with 25/02 etc.

@Wile_E_Coyote thank you. I’m trying

I made a macro and a data file dealing with dates on the X axis:
corona2.c (1.6 KB) corona2.txt (250 Bytes)

thank you @couet it works, but it doesn’t work adding the fit (I think we need 2 x variables, the first one are the numbers to make the fit the second one are the dates to print on the plot). Anyway, don’t worry…it isn’t a problem to have the number instead of the data…

The real problem is how to fit data…because I did it, but you see that parameters are so high, then the upper limit of the function is very high too (I mean this plot https://root-forum.cern.ch/uploads/default/optimized/3X/9/f/9f084345c3ffdd5be42c8b4571292461b5e7676c_2_943x748.png)

Ok for the fitting part I let @moneta help you.

Thank you @couet anyway I’m trying to use the @Wile_E_Coyote advice , but I can’t find the right initial values

@moneta this is my last macro
corona.c (2.3 KB)

Hi,

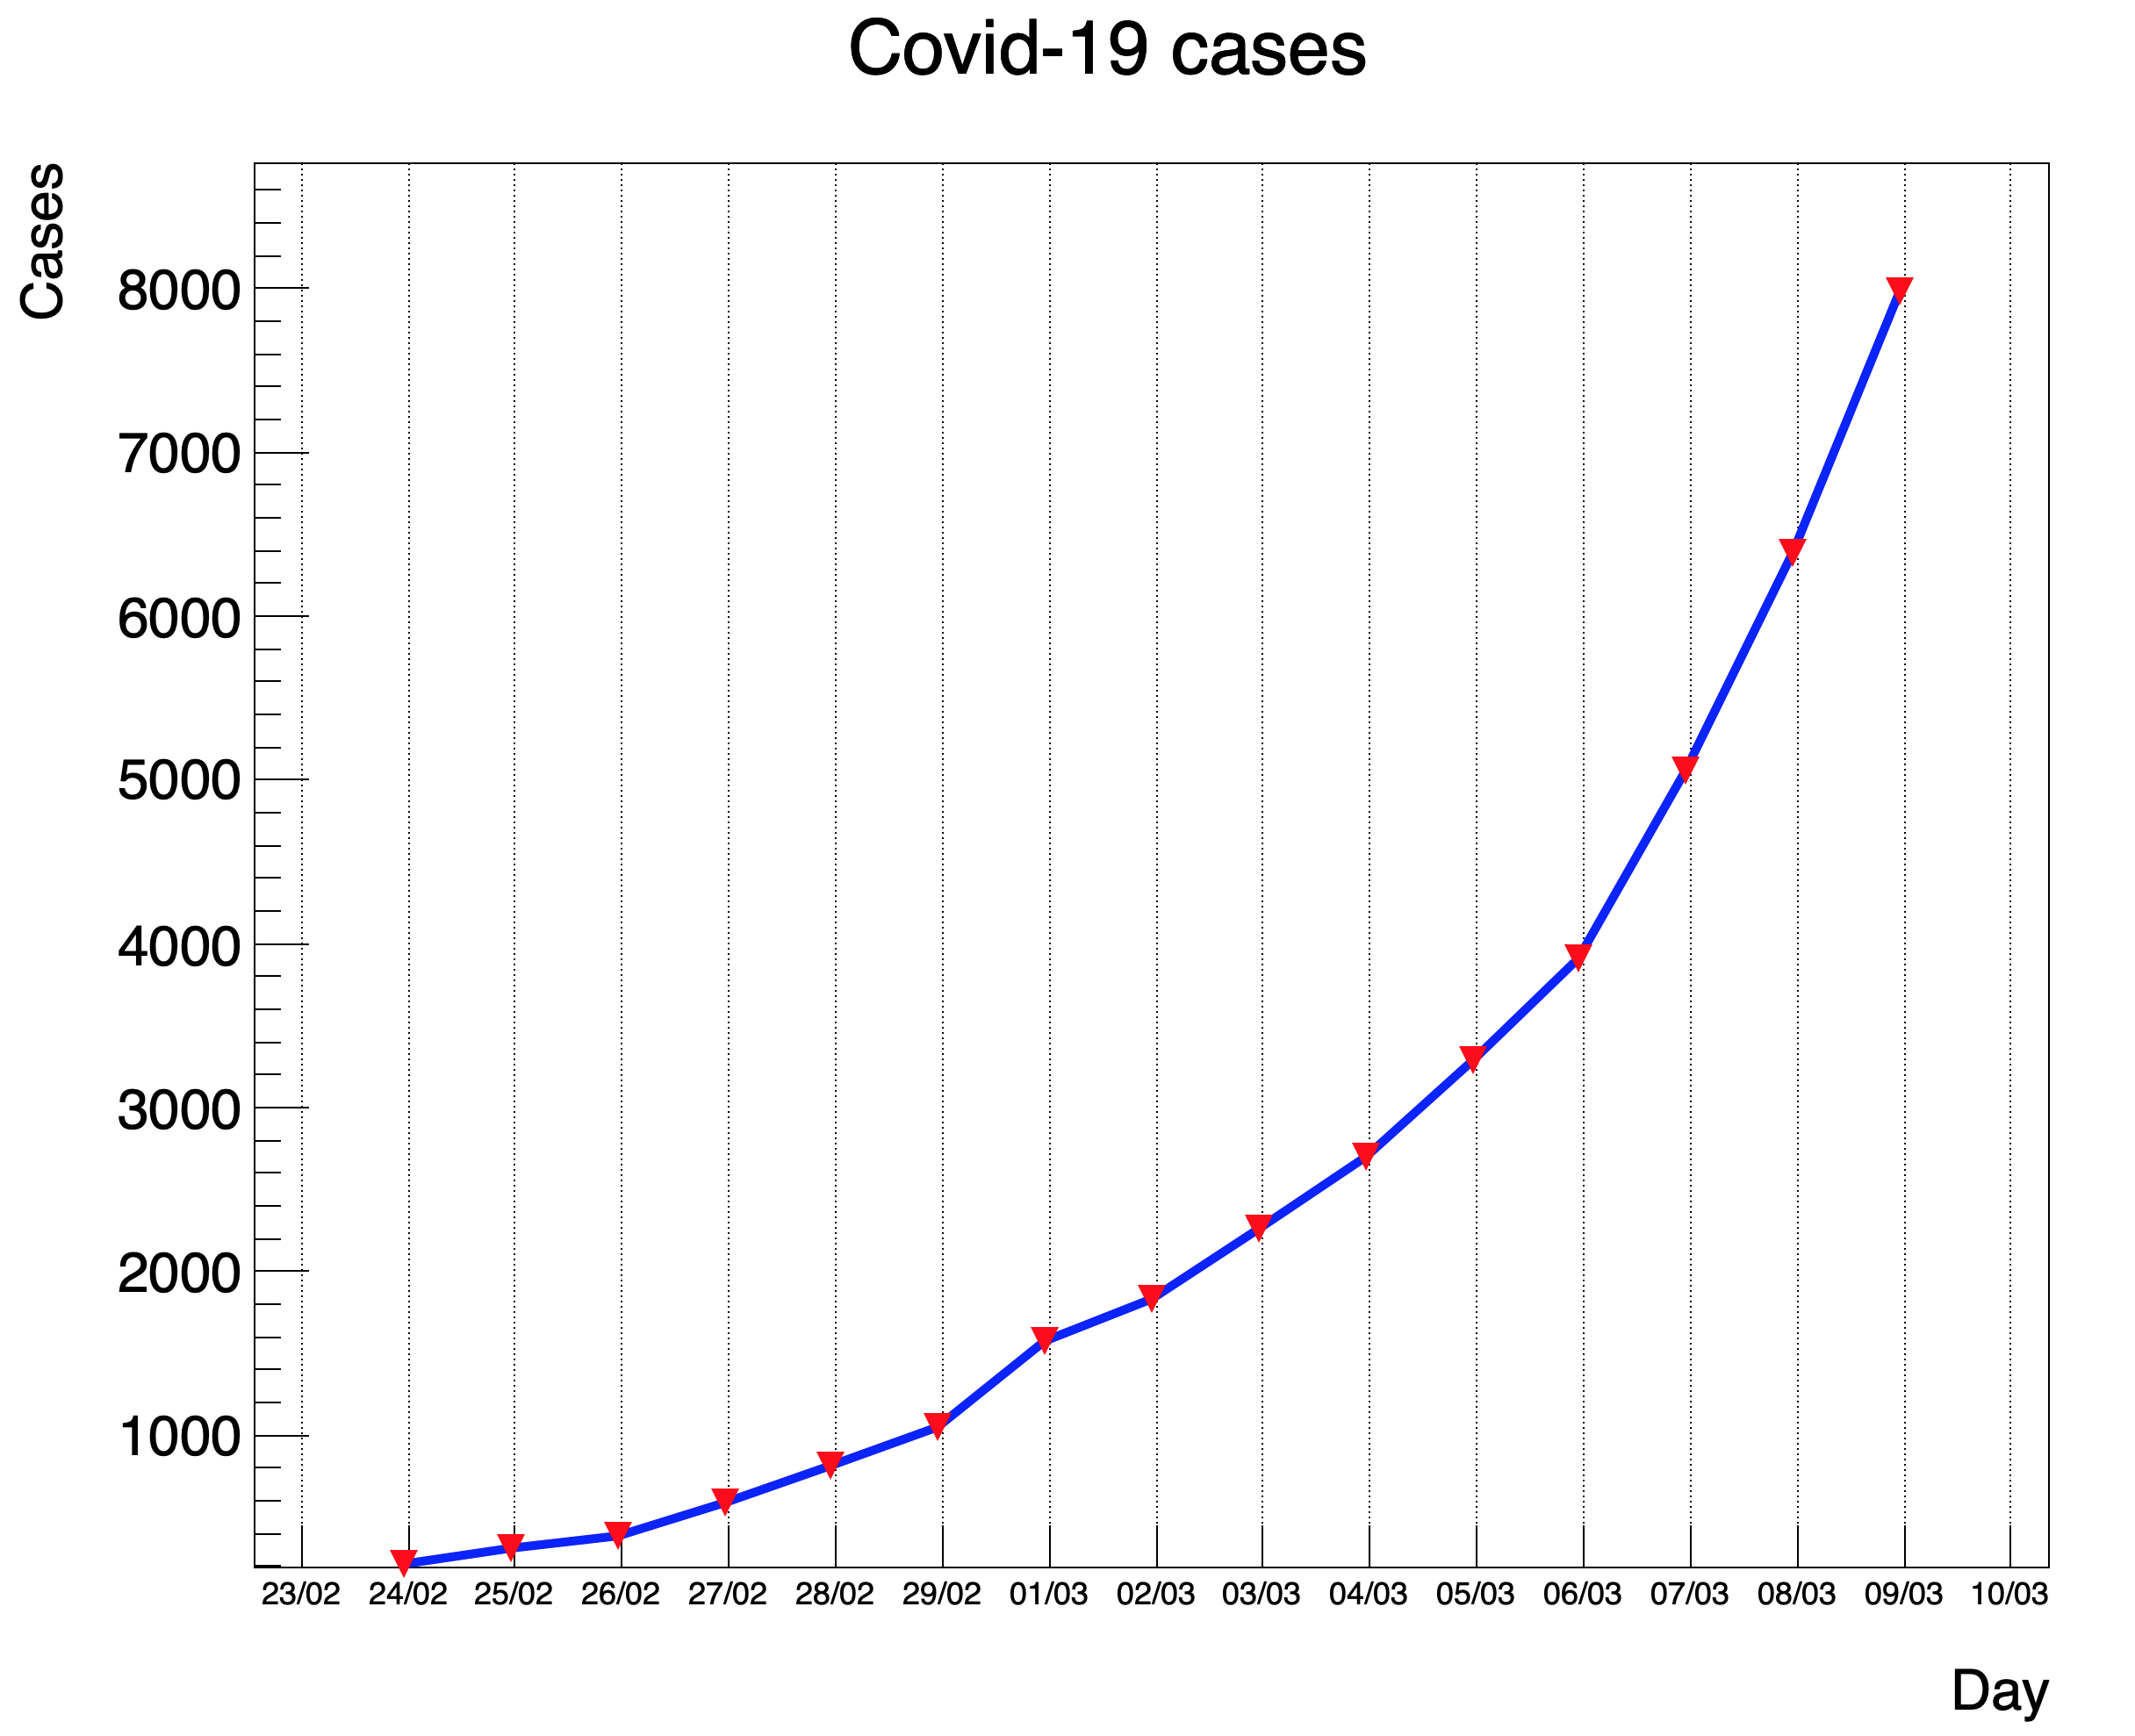
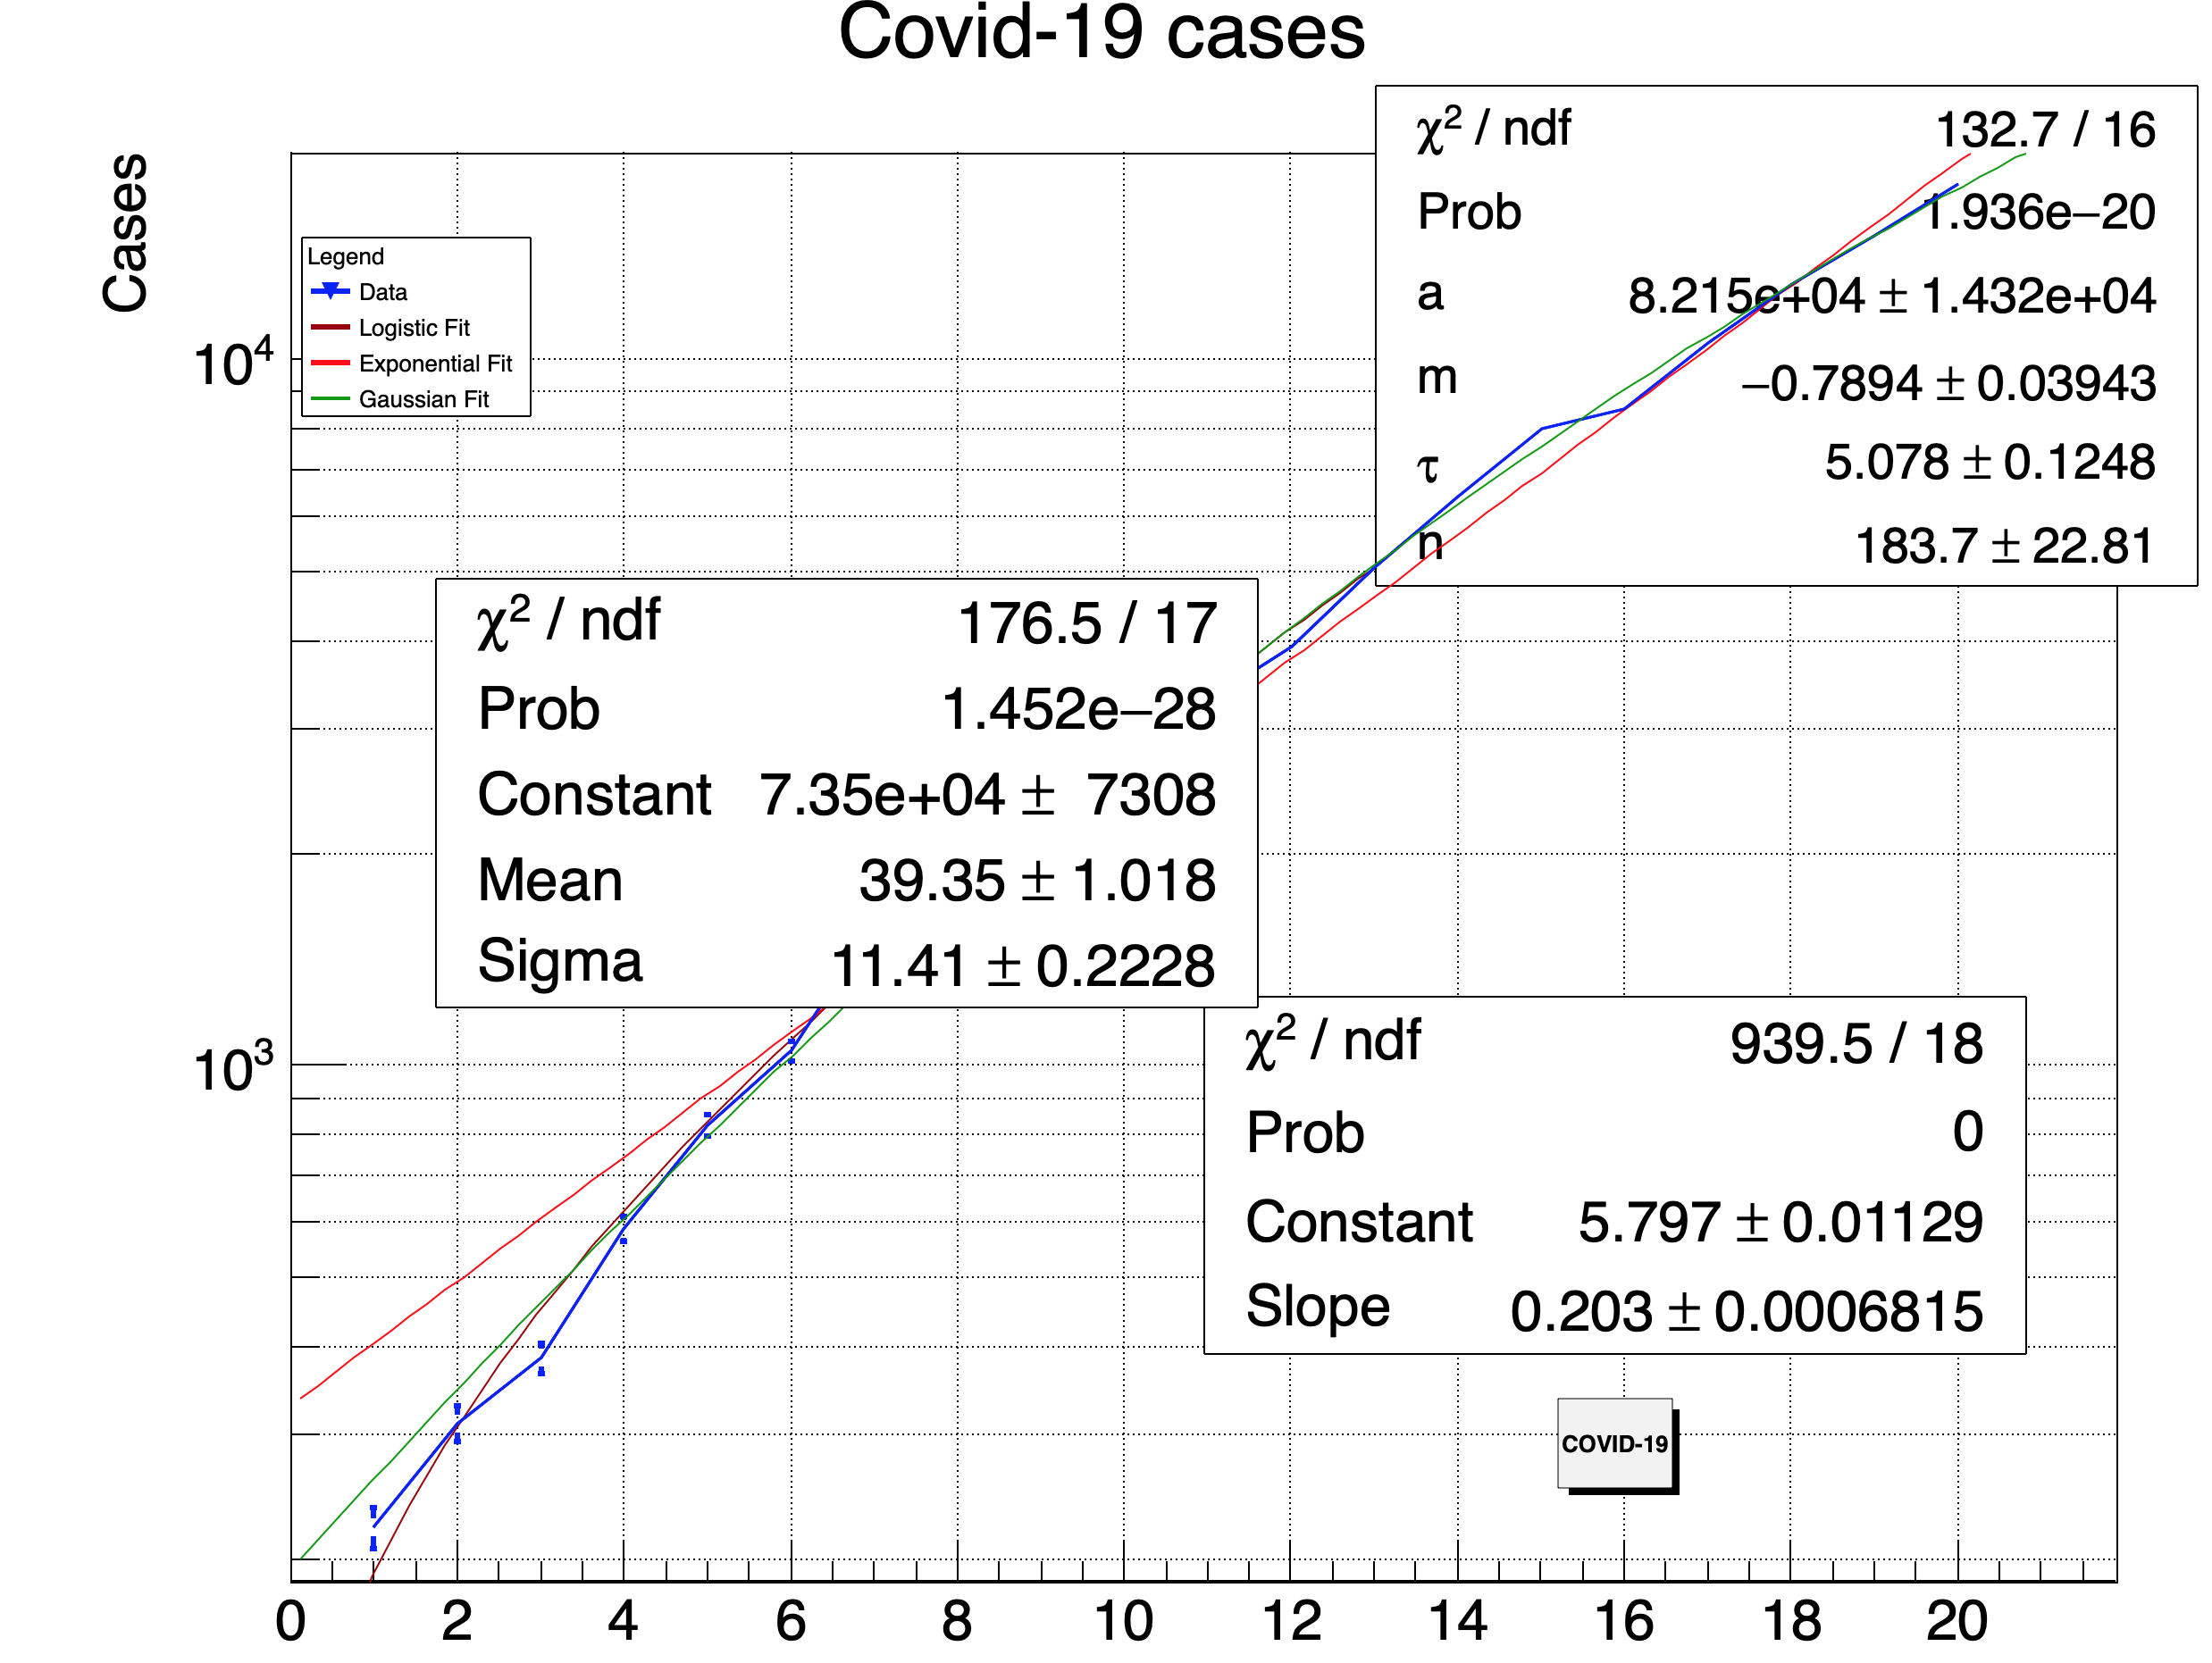
I think it will be difficult to fit the logistic function to that data. There is no data which show the flattening you would expect with such function. You might try setting some bounds and good initial value to get better results, but it will not probably give you a good chi2. Instead you will get a better fit with an exponential.
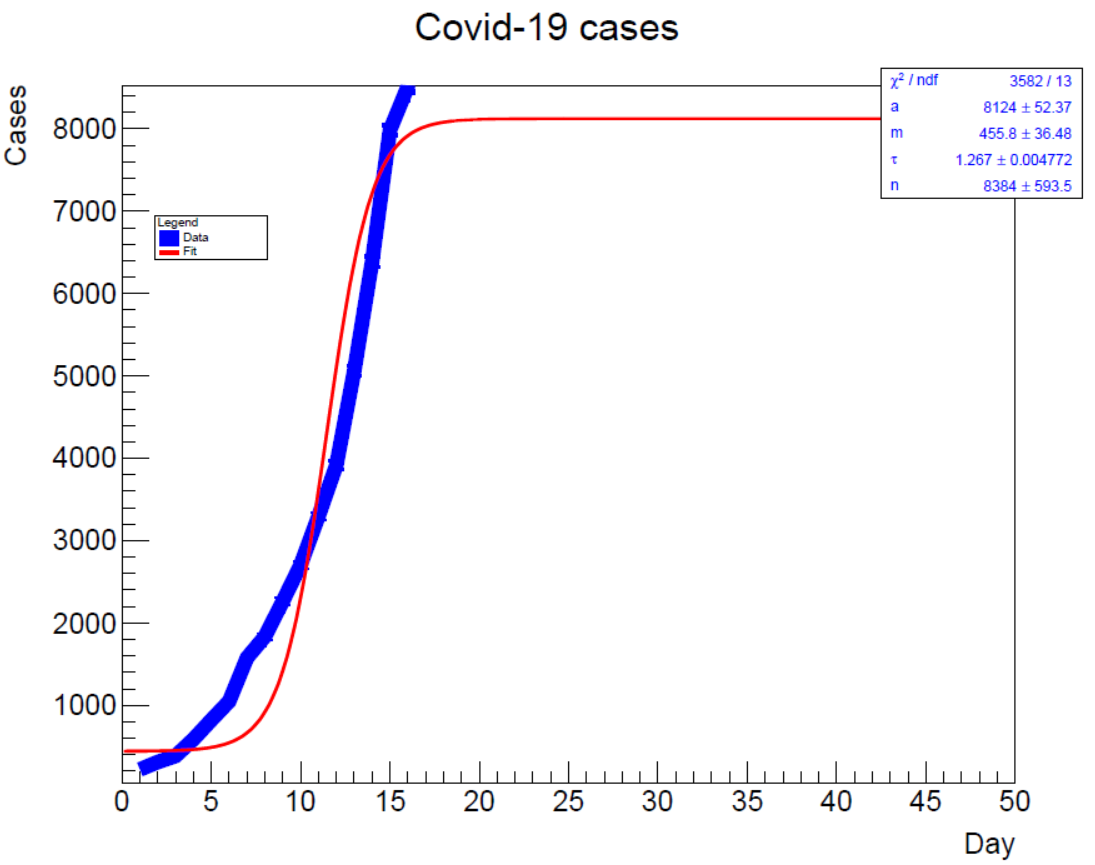
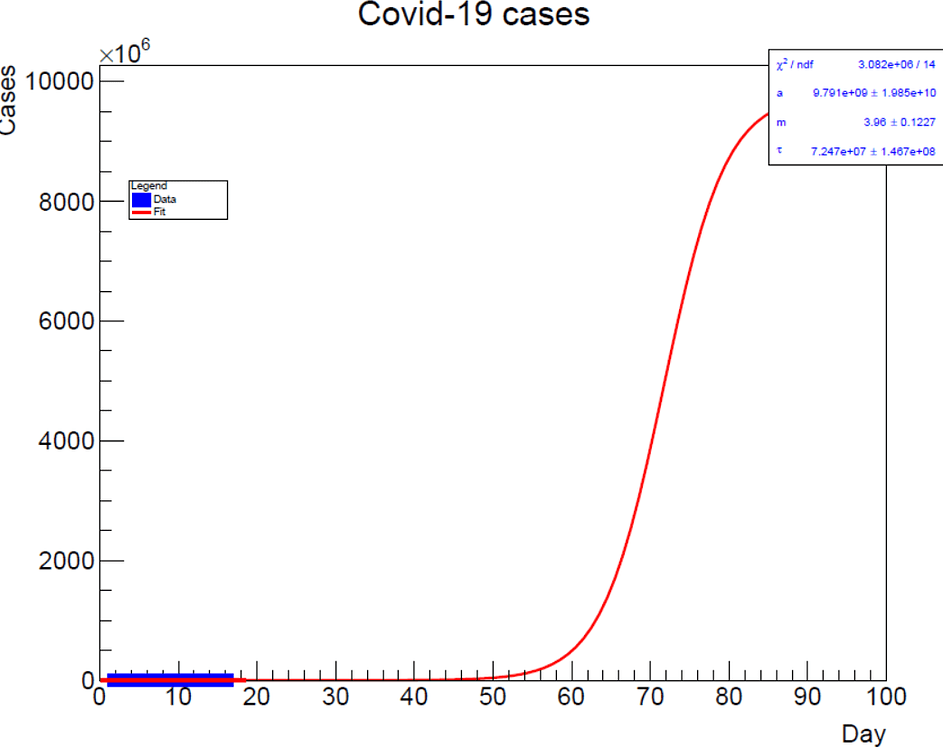
I attach a corrected macro where I get a converged fit using some parameter limits

Lorenzo

corona.C (2.7 KB)

Hi,
the logistic function will give much better fit if you change the upper limit of par[0]
to 50000 (and the lower limit of par[1] to -1).
Smbat

Thanks to the both.

Following @smbat advice, I wrote


	TF1 *fitspettro = new TF1("fitspettro", "gaus");
	TF1 *fitspettro = new TF1("fitspettro", "[0] * (1+[1]*TMath::Exp(-x/[2]))/(1+[3]*TMath::Exp(-x/[2]))", 0,25);
	fitspettro->SetParName(0,"a");
    fitspettro->SetParName(1,"m");
    fitspettro->SetParName(2,"#tau");
    fitspettro->SetParName(3,"n");
    fitspettro->SetParameter(0,2);
    fitspettro->SetParameter(1,60);
    fitspettro->SetParameter(2,5);
    fitspettro->SetParameter(3,300);
    fitspettro->SetParLimits(0,0,50000);
    fitspettro->SetParLimits(2,-1,50000);
	gamma->Fit("fitspettro");

and really it looks like a better fit (even if we can’t know if the upper limit 50000 is a good one). This is what I get

I also read @moneta macro, it works, but it is just the fit, there isn’t the prevision for next days. I tried to modify @moneta’s macro following @smbat advice about the parameters and trying to print the prevision for exponential and logistic function…but the macro doesn’t works fine, I just get an exponential function

…I did some errors…please @moneta can you fix it?

corona.C (2.7 KB)

Hi,

Here is your macro corrected for some errors
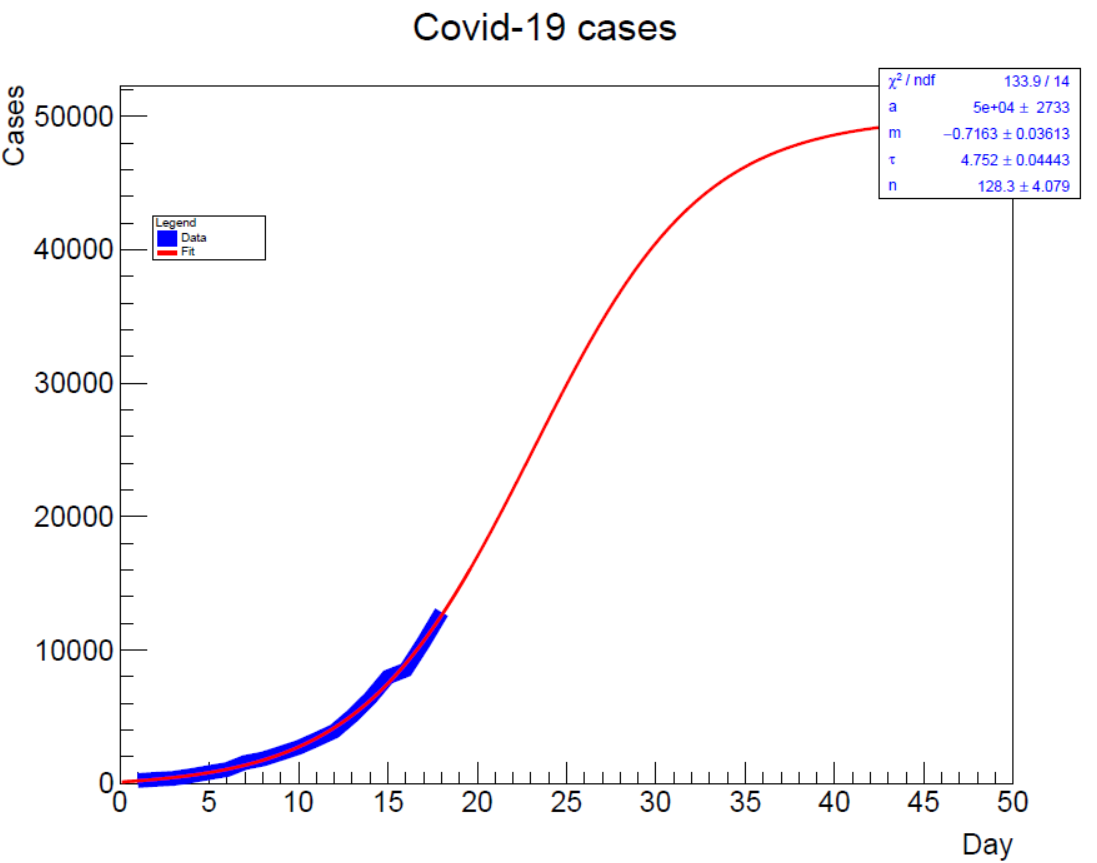
Also, as suggested by @smbat, I have relaxed the first parameter of the logistic function. The fit gives a slightly better chi-square for a very high value. I guess one needs more data (hopefully showing the good slowing down behaviour) and we can then maybe get a better constraint on that parameter.

Lorenzo
corona.pdf (17.6 KB) corona.C (3.2 KB)

thank you @moneta. Last question in the box stat I read the fit parameters of the logistic function. Given that there are two fits, is it possible to have a second box for the exponentional function too?
I tried , but it doesn’t work…

Ps. One more question, i see you wrote that data must be printed on the top…but the looks like covered by functions …

Anyway, surely @Wile_E_Coyote and @couet are able to fix these problems

H ere the macro and the updated data

corona.cpp (4.2 KB)

corona.txt (170 Bytes)

The fit boxes are drawn by:

   gamma->Draw("AL");
   gamma2->Draw("L");
   gamma3->Draw("L");

Thank you @couet it worked!

This topic was automatically closed 14 days after the last reply. New replies are no longer allowed.