faca87
March 8, 2020, 2:13pm
1
Hi, I looked the cases number of corona virus cases in Italy day by day. http://opendatadpc.maps.arcgis.com/apps/opsdashboard/index.html#/b0c68bce2cce478eaac82fe38d4138b1
I would like to dit data by a logistic function
I wrote the macro, but:
The fit doesn’t work fine
I would like to continue to plot the funciont for n day…for example, if I’ve data of m<n days, I would like to see the fit until the n day
Should it be possible to write the day on the x label? I mean 24/02, 25/02, etc instead of 1,2,3,etc
In attachment the macro and the datacorona.txt (103 Bytes)
corona.c (2.5 KB)
Thanks
Please read tips for efficient and successful posting and posting code
ROOT Version: 6.18/04Platform: Windows10Compiler: Not Provided
In ROOT, before you try to fit your graph or histogram, you MUST set “reasonable” initial values for ALL parameters of your function (except for some “built-in” formulas, like “gaus”, for which the standard fit procedure can automatically “guess” them), otherwise the fitting procedure may easily misbehave.
Search for “Setting initial conditions” in the TGraph::Fit and TH1::Fit methods descriptions.
faca87
March 8, 2020, 4:39pm
3
Hi @Wile_E_Coyote , I wrote
fitspettro->SetParameter(0,1);
   fitspettro->SetParameter(1,1);
   fitspettro->SetParameter(2,1);
   fitspettro->SetParameter(3,1);
but I don’t have any idea about the reasonable values…do you have any idea?
Try to draw your function without doing the fit and see if it looks like your data (it not, you need to play with parameters).
For your point 2., try (after the fit):
your_function->SetRange(0., n_day);
your_function->Draw(); // first the "full" function
your_graph->Draw("L SAME"); // add the graph
faca87
March 8, 2020, 8:41pm
7
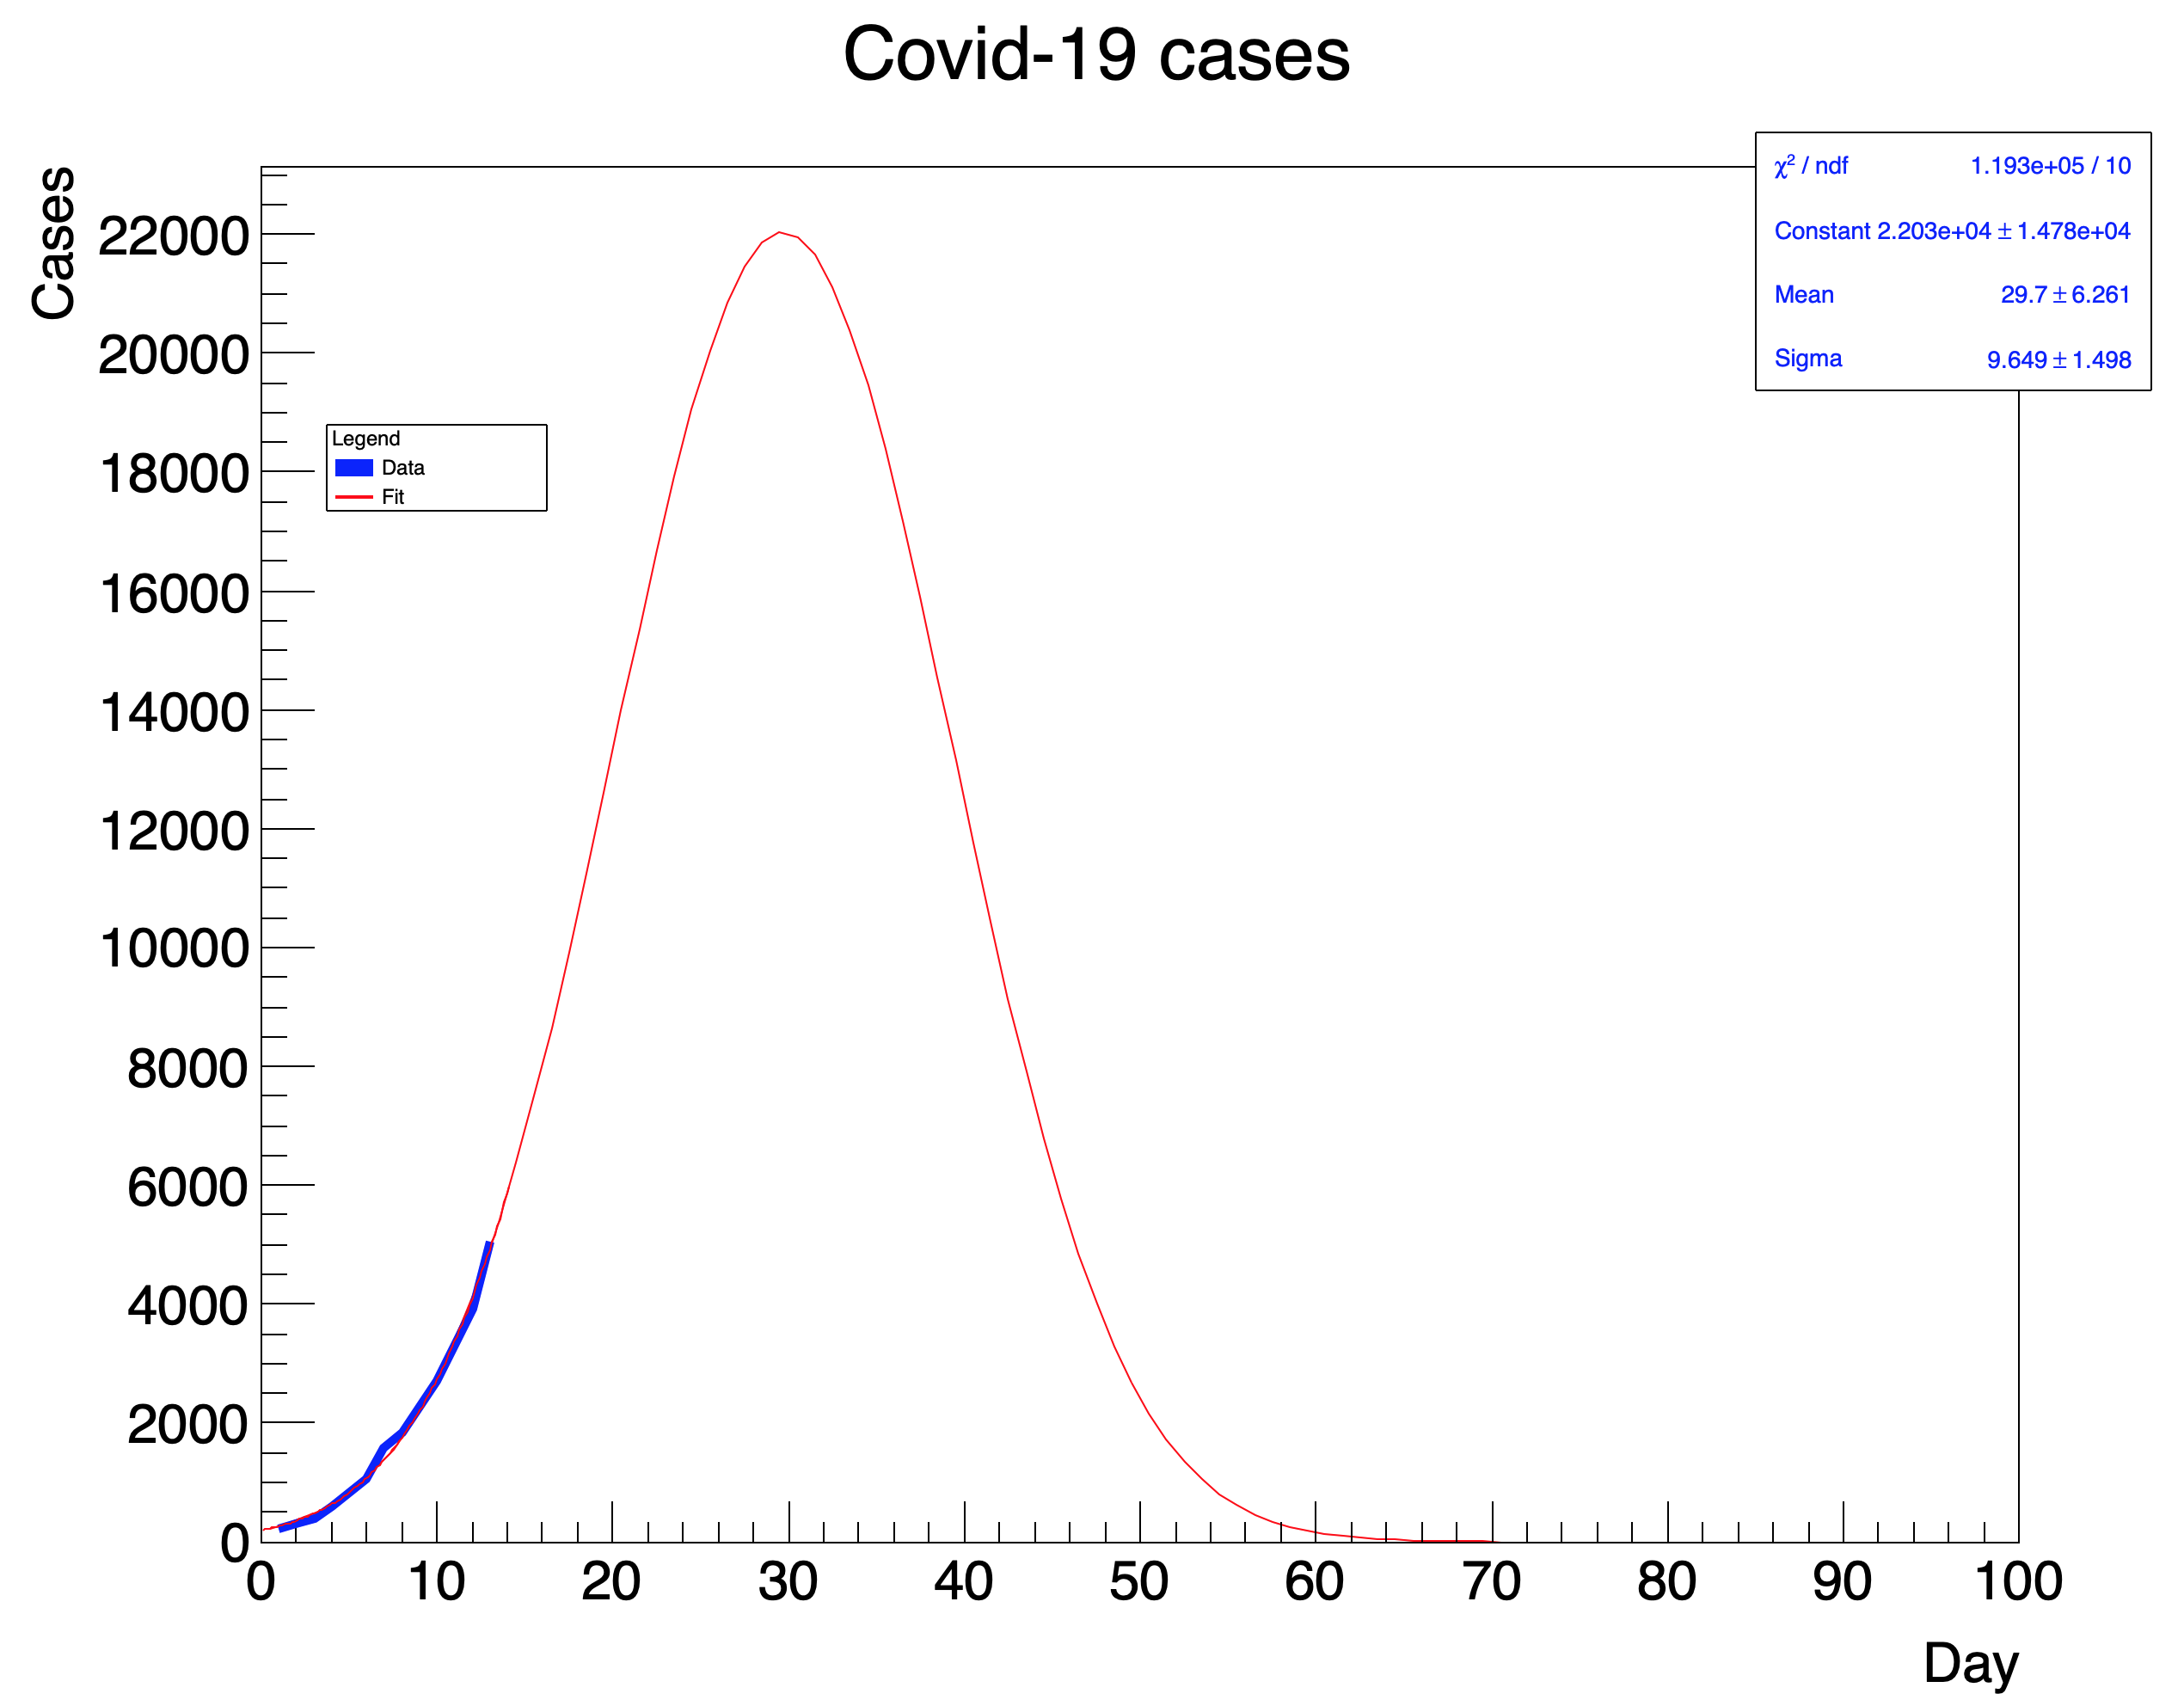
Hi Wile, for the moment I’m using a gaussian function and your code works I get the grah, but I’d lile to write the stat box for the fit parameters.
TPaveStats *stats1 = (TPaveStats*)fitspettro->GetListOfFunctions()->FindObject("stats");
 stats1->SetX1NDC(0.80); stats1->SetX2NDC(0.98);
   stats1->SetY1NDC(0.77); stats1->SetY2NDC(0.92);
I get error…how can i write the stat box?
corona.pdf (15.4 KB)
couet
March 9, 2020, 7:56am
8
Can you post the latest version of your macro ?
faca87
March 9, 2020, 8:10am
9
Hi @couet sorry, instead of to upload the macro, I uploaded the pdf graph
corona.c (2.9 KB)
couet
March 9, 2020, 8:42am
11
A simpler version of your macro:
void corona() {
	gStyle->SetOptFit();
	const char *datagamma = "corona.txt";
	const char *dataout = "corona.pdf";

	TCanvas *c36 = new TCanvas("c36","multigraph",1280,1024);
	float offx=1.3;
	float offy=1.7;
	float margr=0.08;
	float w=3;
	float margl=0.12;
	gPad->SetLeftMargin(margl);
	gPad->SetRightMargin(margr);

	TGraphErrors *gamma = new TGraphErrors(datagamma,"%lg %lg");
	gamma->SetMarkerColor(kBlue);
	gamma->SetLineColor(kBlue);
	gamma->SetMarkerStyle(23);
	gamma->SetLineWidth(10);

	TF1 *fitspettro = new TF1("fitspettro", "gaus");
	gamma->Fit("fitspettro");
	fitspettro->SetRange(0.,100);
	fitspettro->Draw();
	gamma->Draw("L");

	fitspettro->SetTitle("Covid-19 cases");
	fitspettro->GetXaxis()->SetTitle("Day");
	fitspettro->GetYaxis()->SetTitle("Cases");
	fitspettro->GetYaxis()->SetTitleOffset(offy);
	fitspettro->GetXaxis()->SetTitleOffset(offx);

	TLegend* leg3suball = new TLegend(0.15, 0.7, .25, .75);
	leg3suball->SetHeader("Legend");
	leg3suball->SetNColumns(1);
	leg3suball->AddEntry(gamma, "Data", "l");
	leg3suball->AddEntry(fitspettro, "Fit", "l");  //TO USE FOR 2 GAUSSIAN FIT
	leg3suball->Draw();

	c36->Print(dataout);
}
I guess the question is how to get the “fit stat box” incorporated into the created legend (i.e. not as a separate box).
couet
March 9, 2020, 8:47am
13
They only would be to draw them on top of each other.
faca87
March 9, 2020, 1:57pm
14
Hi @Wile_E_Coyote and @couet
TPaveStats *stat = (TPaveStats*)gamma->GetListOfFunctions()->FindObject("stats");
	stat->SetTextColor(kBlue);
	stat->SetX1NDC(0.80); stat->SetX2NDC(0.98);
	stat->SetY1NDC(0.77); stat->SetY2NDC(0.92);
but in this case, it doesn’t work (I think because of it is a TGraph),
corona.pdf (15.5 KB)
corona.c (2.0 KB)
couet
March 9, 2020, 2:15pm
15
it works for me:
void corona() {
	gStyle->SetOptFit();
	const char *datagamma = "corona.txt";
	const char *dataout = "corona.pdf";

	TCanvas *c36 = new TCanvas("c36","multigraph",1280,1024);
	float offx=1.3;
	float offy=1.7;
	float margr=0.08;
	float w=3;
	float margl=0.12;
	gPad->SetLeftMargin(margl);
	gPad->SetRightMargin(margr);

	TGraphErrors *gamma = new TGraphErrors(datagamma,"%lg %lg");
	gamma->SetMarkerColor(kBlue);
	gamma->SetLineColor(kBlue);
	gamma->SetMarkerStyle(23);
	gamma->SetLineWidth(10);

	TF1 *fitspettro = new TF1("fitspettro", "gaus");
	gamma->Fit("fitspettro");
	fitspettro->SetRange(0.,100);
	fitspettro->Draw();
	gamma->Draw("L");

	fitspettro->SetTitle("Covid-19 cases");
	fitspettro->GetXaxis()->SetTitle("Day");
	fitspettro->GetYaxis()->SetTitle("Cases");
	fitspettro->GetYaxis()->SetTitleOffset(offy);
	fitspettro->GetXaxis()->SetTitleOffset(offx);

	TLegend* leg3suball = new TLegend(0.15, 0.7, .25, .75);
	leg3suball->SetHeader("Legend");
	leg3suball->SetNColumns(1);
	leg3suball->AddEntry(gamma, "Data", "l");
	leg3suball->AddEntry(fitspettro, "Fit", "l");  //TO USE FOR 2 GAUSSIAN FIT
	leg3suball->Draw();
	gPad->Update();
   TPaveStats *stat = (TPaveStats*)gamma->GetListOfFunctions()->FindObject("stats");
	stat->SetTextColor(kBlue);
	stat->SetX1NDC(0.80); stat->SetX2NDC(0.98);
	stat->SetY1NDC(0.77); stat->SetY2NDC(0.92);

	c36->Print(dataout);
}
faca87
March 9, 2020, 2:49pm
16
couet:
gPad->Update();
Hi @couet thank you…I think I didn’t write gPad->Update(); before theTPaveStats *stat = (TPaveStats*)gamma->GetListOfFunctions()->FindObject("stats");
Now it is working!
couet
March 9, 2020, 4:09pm
17
faca87
March 10, 2020, 3:12pm
18
Thank you @couet , I followed your example, but on the x axis it just shows always march 10 …
corona.txt (121 Bytes) corona.pdf (15.5 KB)corona.c (2.0 KB)
couet
March 10, 2020, 3:31pm
19
Your x values are not dates . They are just indeces
faca87
March 11, 2020, 8:03pm
20
Hi @couet Then isn’t it possible to write the days?
Anyway, I’m trying to fit by a logistic function. It looks like that the fit follows the points shape, but the values of parameters and the X^2 are so big
Indeed when I try to get the shape for next days, the number of cases is very very big!
corona.c (2.3 KB)
I don’t know how to set initial parameters…
couet
March 12, 2020, 7:52am
21
Yes it is, but what are the real dates ? your x axis is just indeces now.
I let @moneta answer you on that point.
Try with:
// ...
TGraphErrors *gamma = new TGraphErrors(datain, "%lg %lg");
for(int i = 0; i < gamma->GetN(); i++) gamma->SetPointError(i, 0.0, TMath::Sqrt(gamma->GetY()[i])); // ex = 0.0 ... 0.3 ... 0.5
// ...