Vertical line in plot

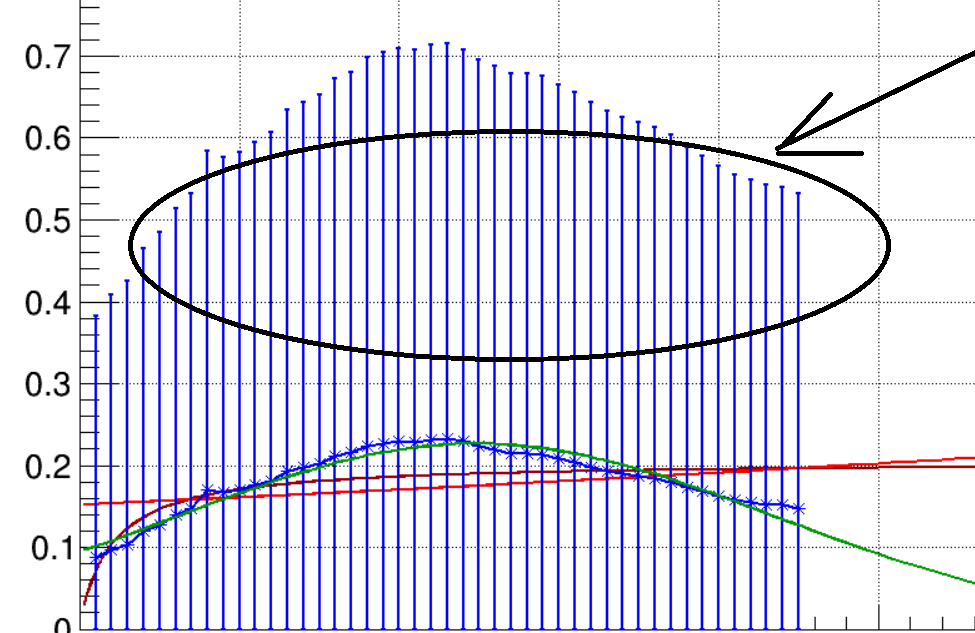
Hi every one, some of you know that I’m fitting covid19 cases in Italy, because of this post . Now I’d like to do also one other graph that is the numer of infections over the number of swabs. When I run the macro, I get some vertical line in the graph…how can I delete them?

In this case, data looks like to follow a gaussian fit, @moneta, do you agree or do you think there is other better fit?

Here macro and data

coronatamp.txt (711 Bytes)
coronatamp.cpp (4.4 KB)


Please read tips for efficient and successful posting and posting code

ROOT Version: 6.20/00
Platform: Windows
Compiler: Not Provided


if 0 < y < 1 then sqrt(y) > y

This is the error bars you set in:

   for(int i = 0; i < gamma->GetN(); i++) 	{
      gamma->SetPointError(i, 0.0, TMath::Sqrt(gamma->GetY()[i]));
   }

Thank you @Wile_E_Coyote and @couet.
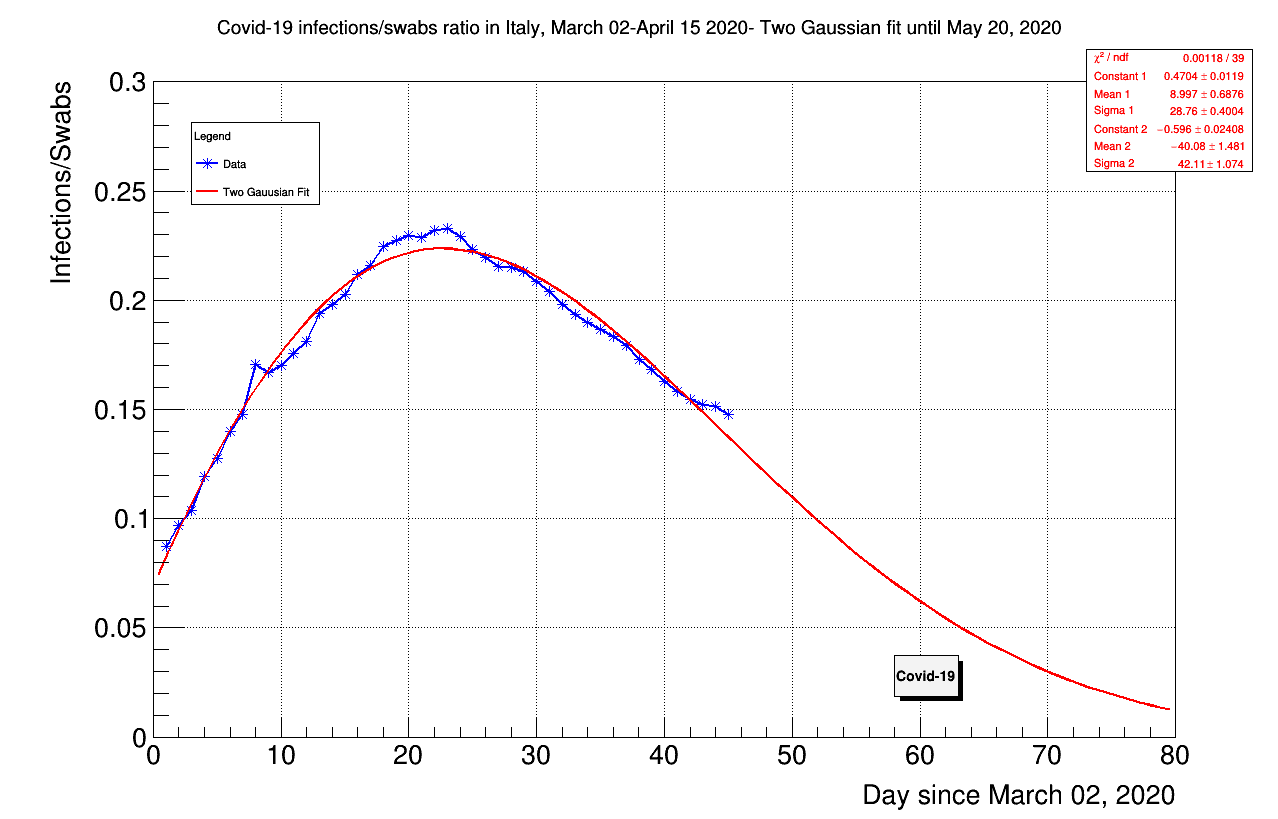
I tried to fit by a two gaussian fit. Usually, when I fit by using a two gaussian fit, one of the two means in the stat box corresponds to the peak in the graph. In this case no one of the two values corresponds to the peak. Do you think is it ok or not?

coronatamp.cpp (2.9 KB)

coronatamp.txt (711 Bytes)

This topic was automatically closed 14 days after the last reply. New replies are no longer allowed.