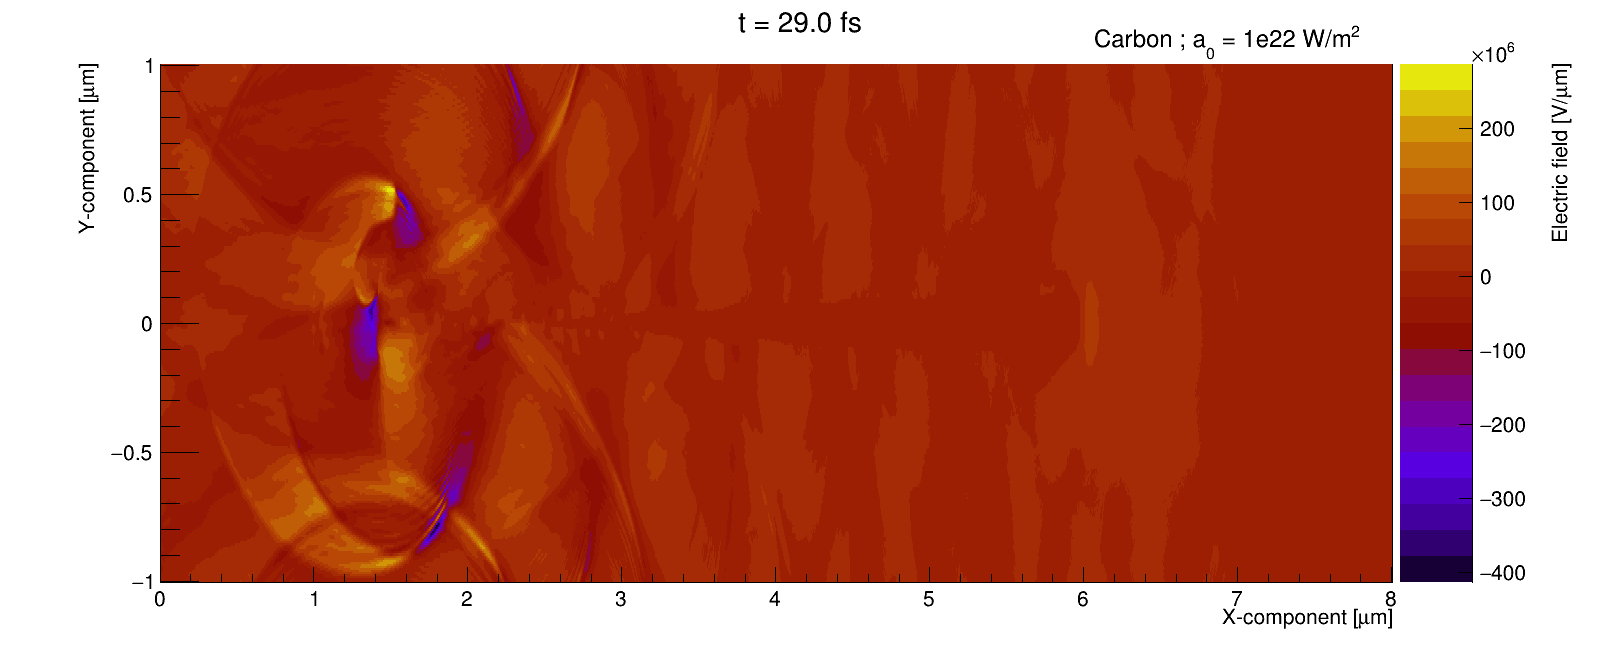
I am working on laser wake field interaction study. I am using pyroot for my visualization need to study the electric field fluctuation across a nano-tube.
The simulation study requires visualization of the electric field (positive and negative) across the nanotube.
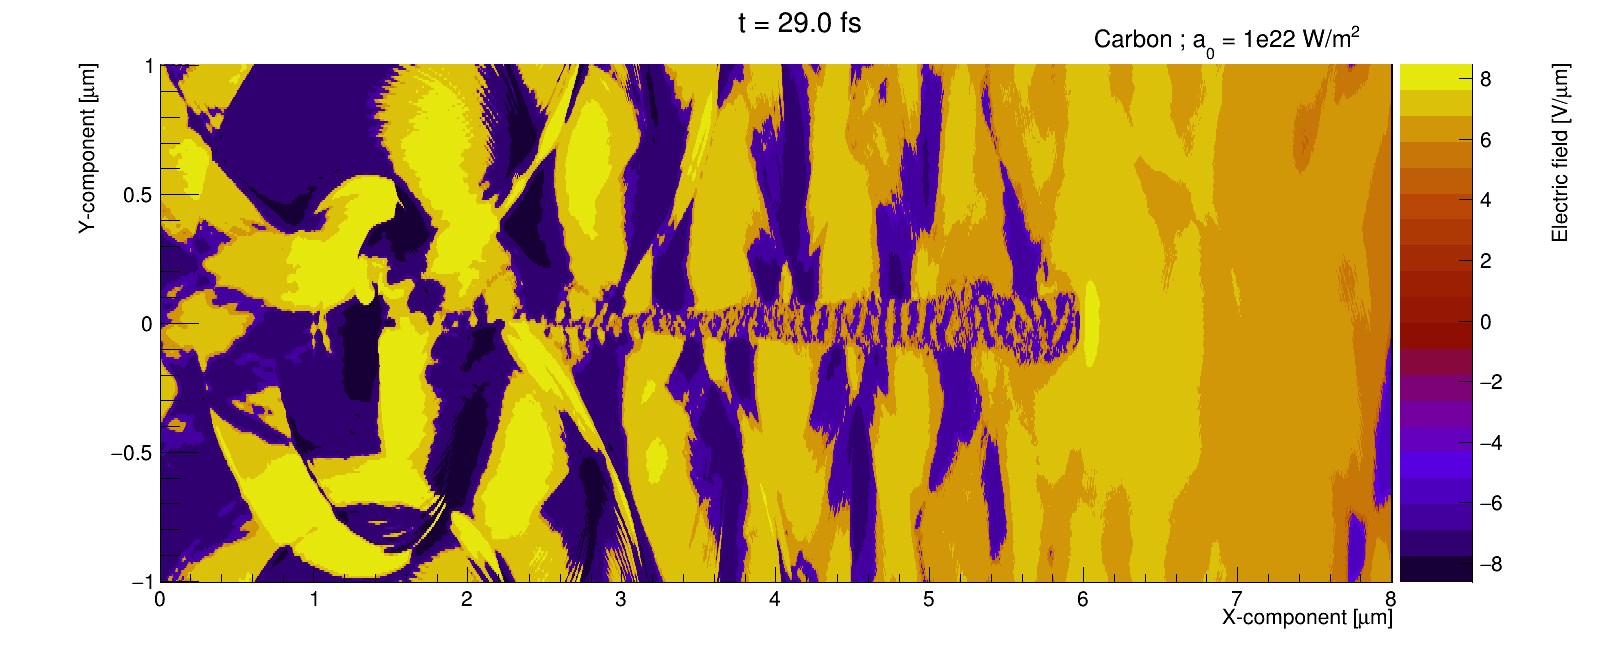
@couet I think it’s about something like “((x > 0) ? log(x) : -log(-x))” (this introduces an ambiguity between “x” and “-1/x”, e,g., for “abs(x) <= 1” the simplest “protection” could be to force the result to 0 in these cases). See the x-axis in: Logarythmic axis on negative values
I don’t know how many points you have with abs(z) <= 1. Maybe you should “remove” these points from your plot or set the log(z) to 0 for them. The problem is that, for these points, log(z) == -log(-(-1/z)) and -log(-z) == log(-1/z) so this “mixes” these points in the plot with points for which abs(z) > 1 (i.e., z and -1/z will get the same “color”).
Thanks for the suggestion, the current plot does not contain abs(z) <=1, most of the points distributed at the two extrema.
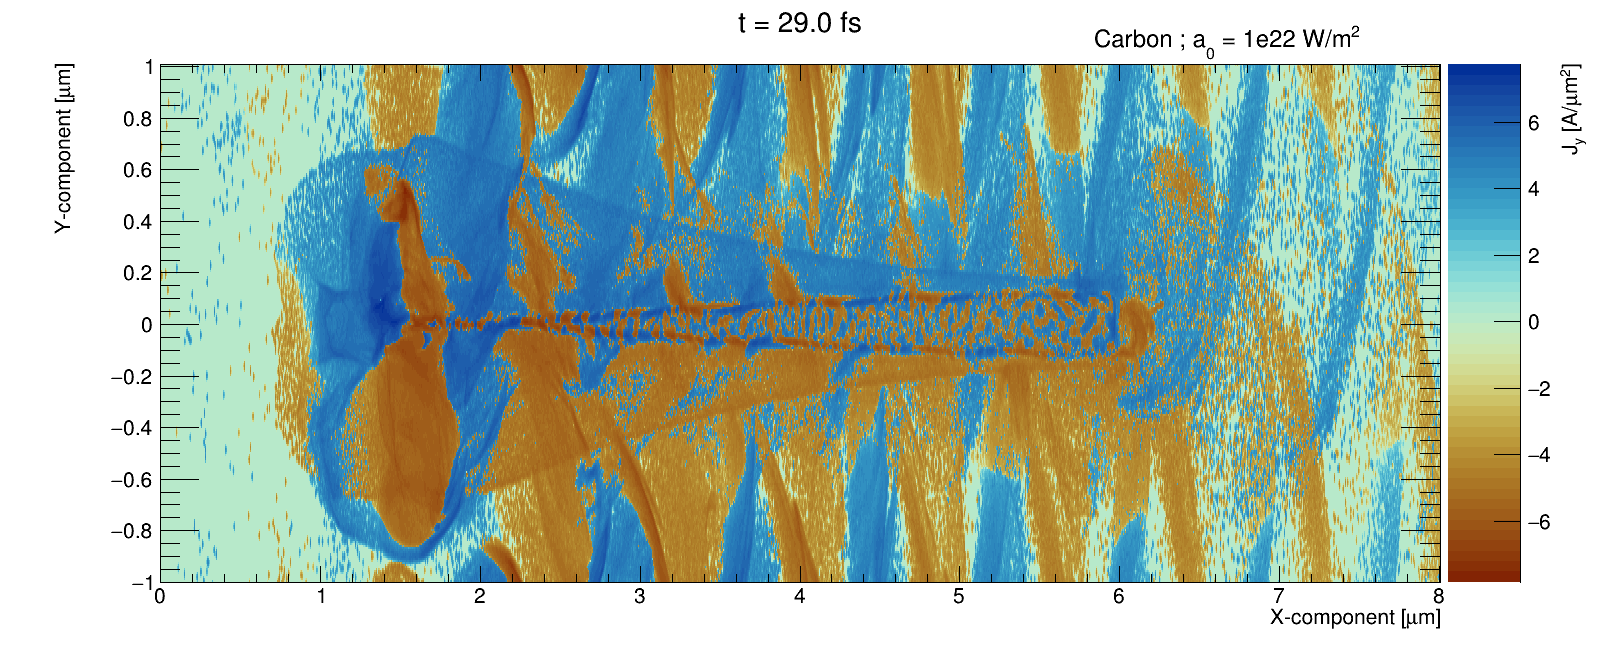
The next plot show the point with abs(z) ~ 1, and it is consistent with the expectation (there are no currents found outside (distance area) of the rectangular lying cylindrical tube, laser incident from the left).