Hi everybody,
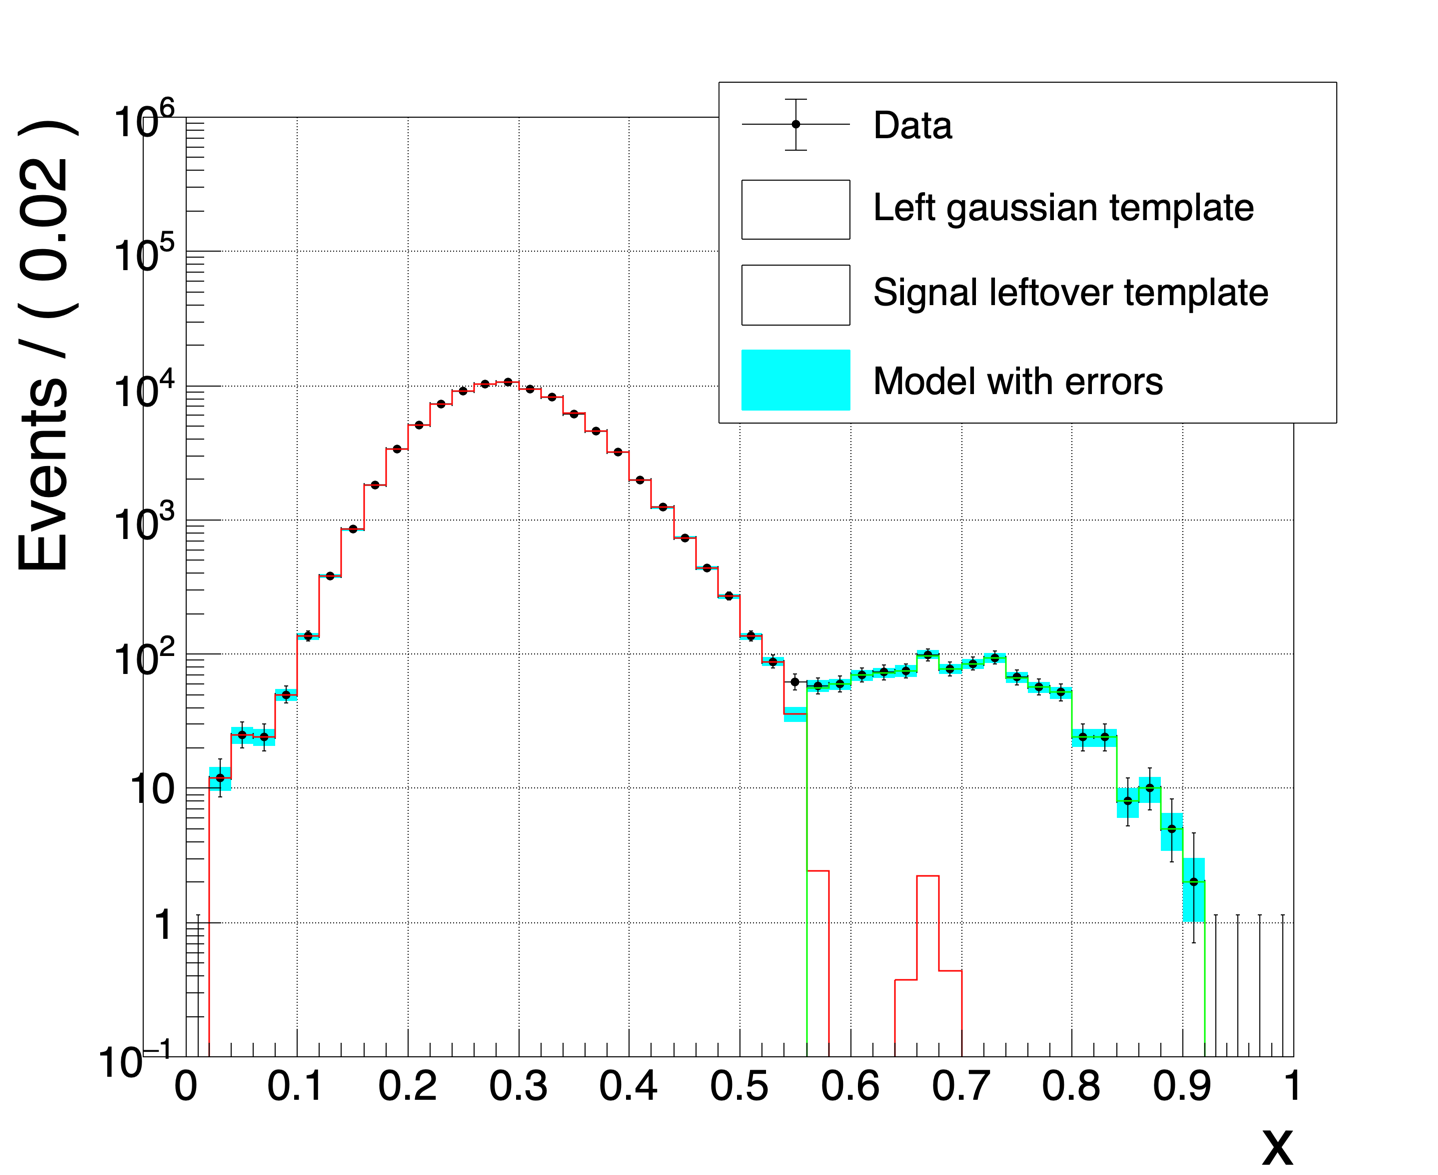
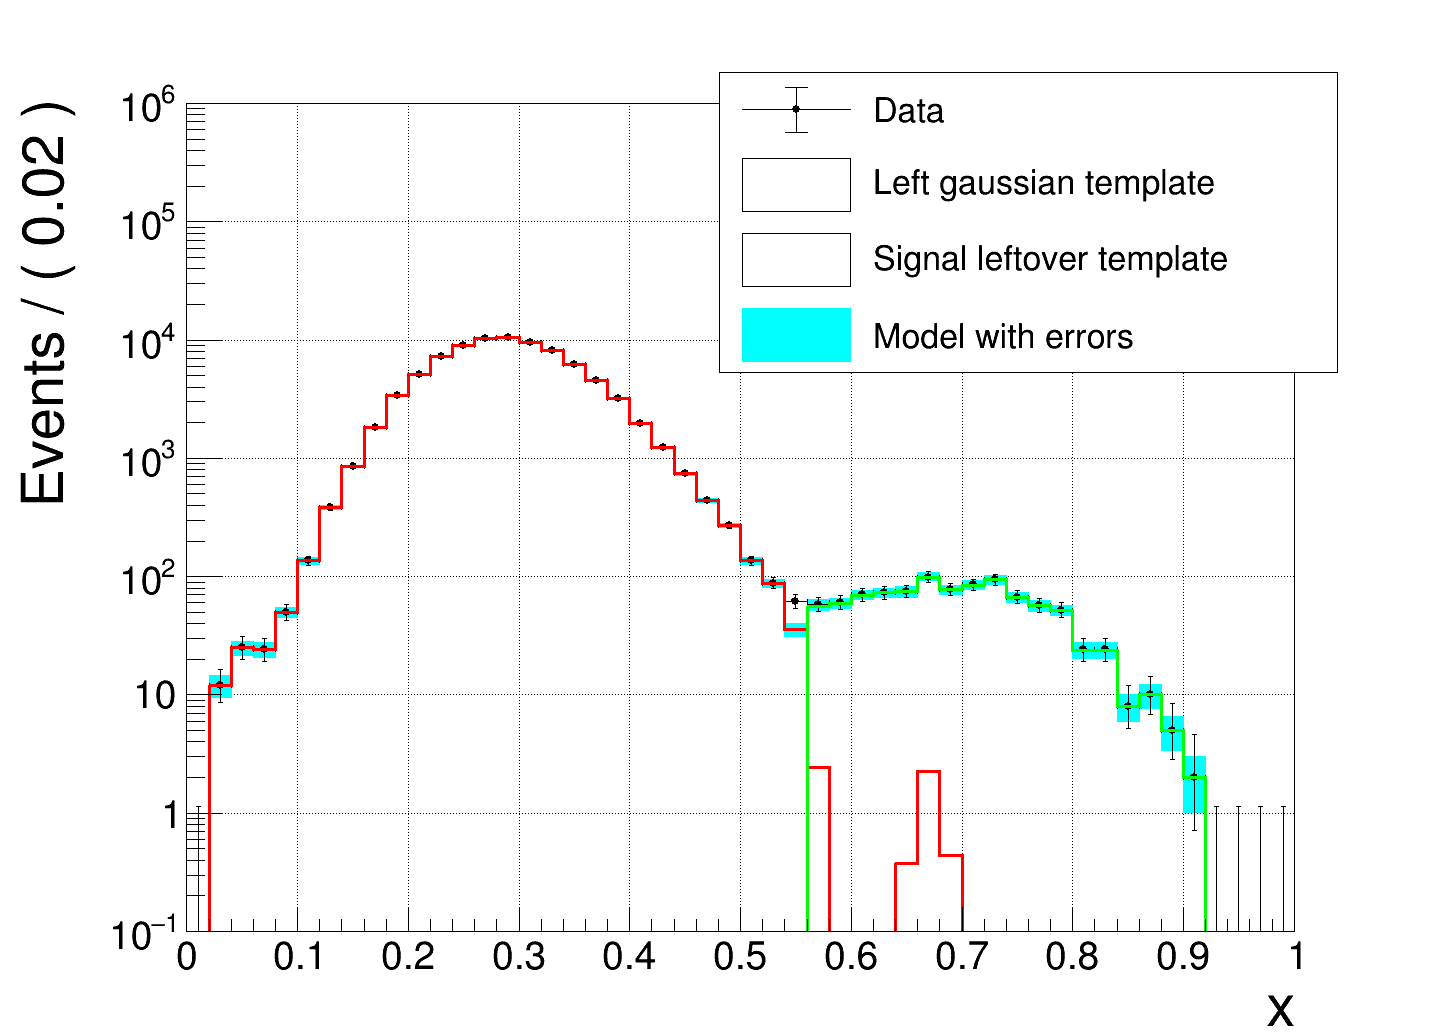
I have some trouble with a RooPlot lately. What I try to do is using a histogram as input pdfs and then fit the pdfs to the same or some other histogram with Roofit. Afterwards I would like to plot the data, the model components and the model with errors. On the linear scale this works perfectly and everything looks nice. However, as soon as I switch to a log-scale weird things start to happen. Sometimes model components are drawn outside of the plotting area:
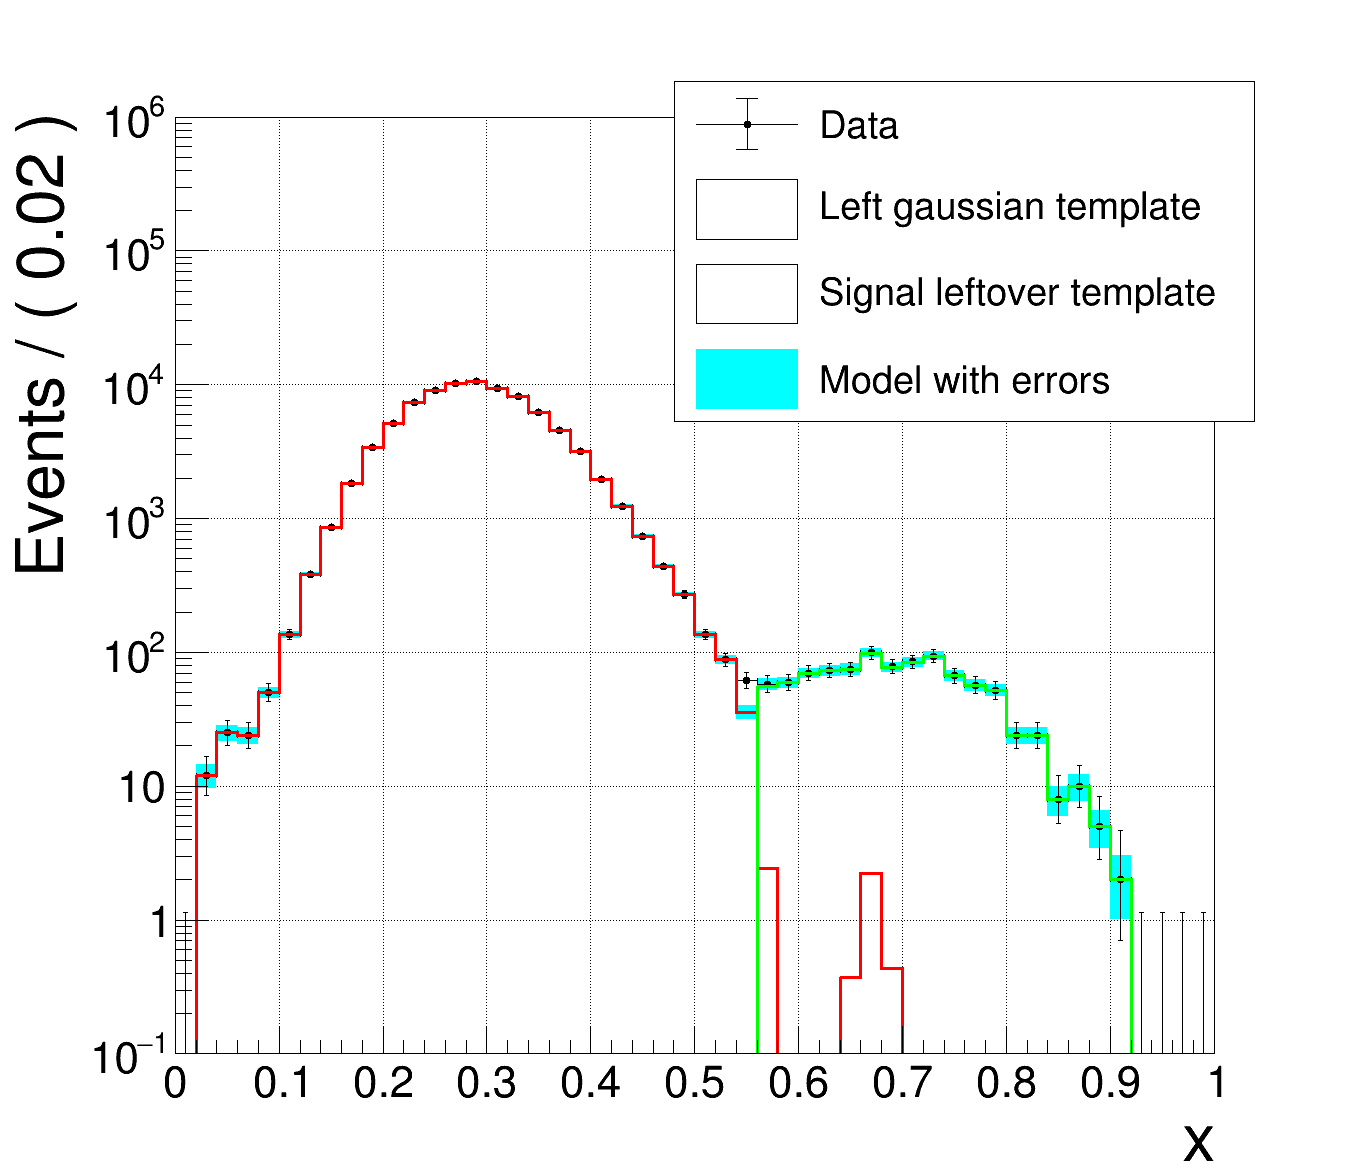
If I also plot the model with “VisualizeErrors” it gets even worse:
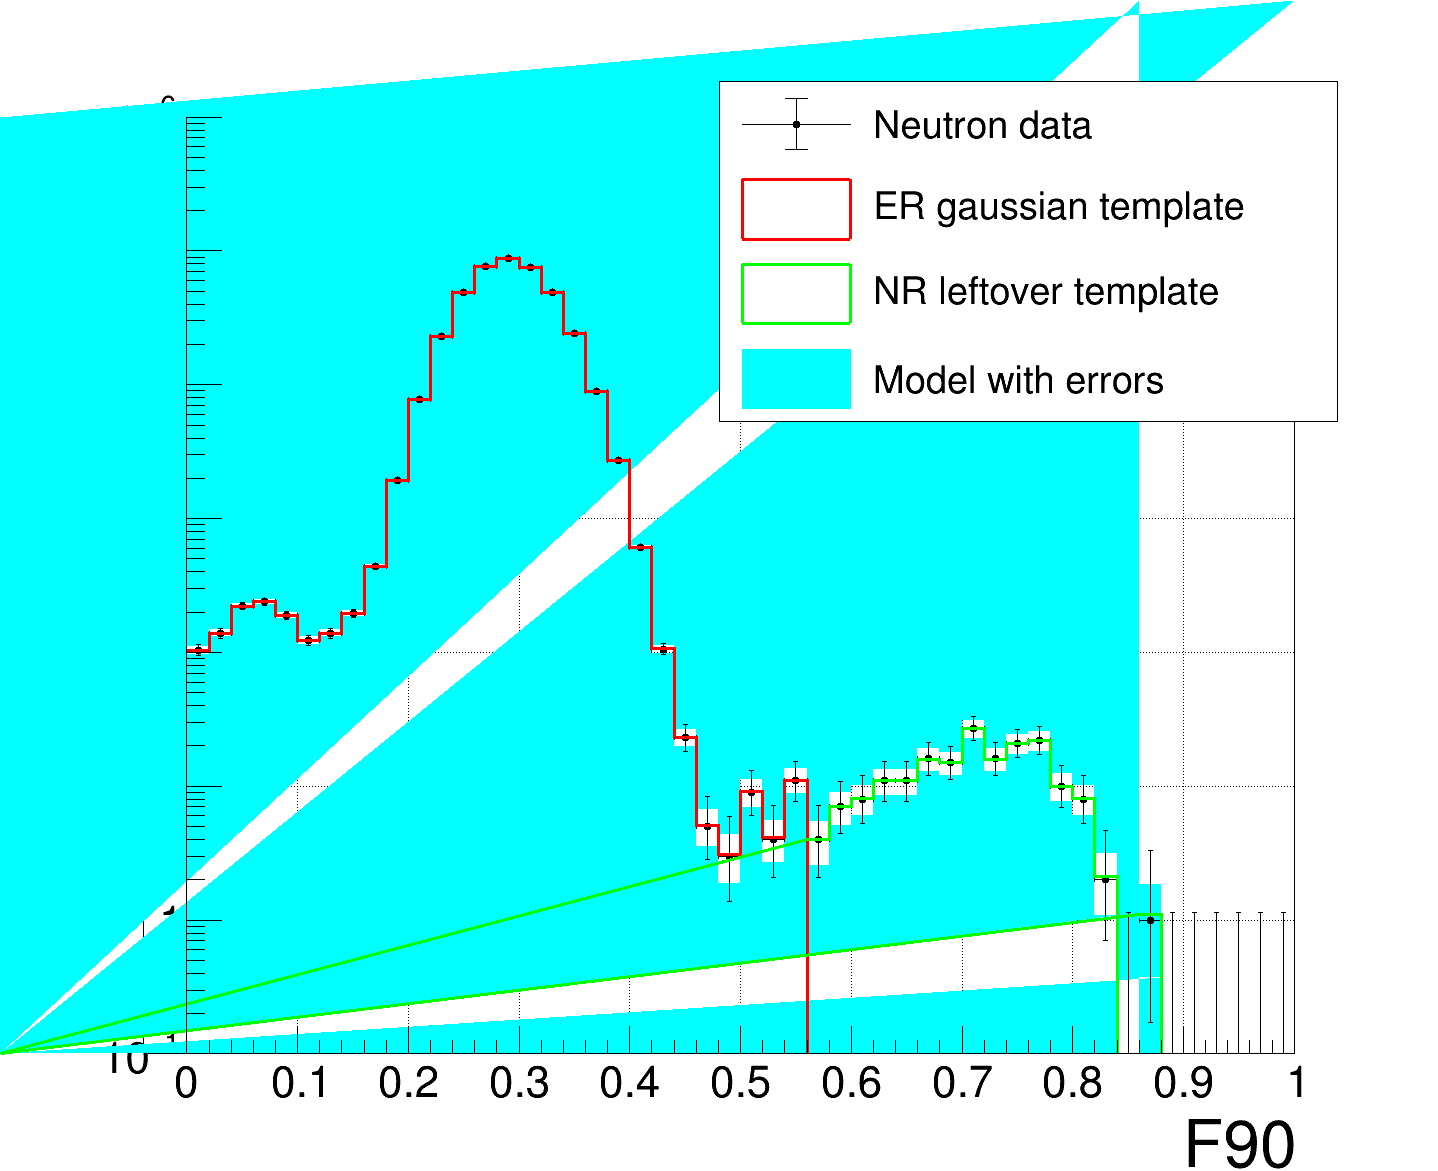
In the first case, clicking on some of the weird components (in the canvas) immediately removes the weird parts. However, this is not ideal for me as I would like to produce many plots directly and not cure and save every single plot by hand. In the second case (Model with error) not even clicking resolves the issue. I also tried to invoke canvas->Modified() and canvas->Update() without success. Could you please help me?
I am using Root 6.18/02 on ubuntu 16.04.
The plot is created as:
TCanvas *c03 = new TCanvas("c03", "c03", 80, 0, 1440, 1200);
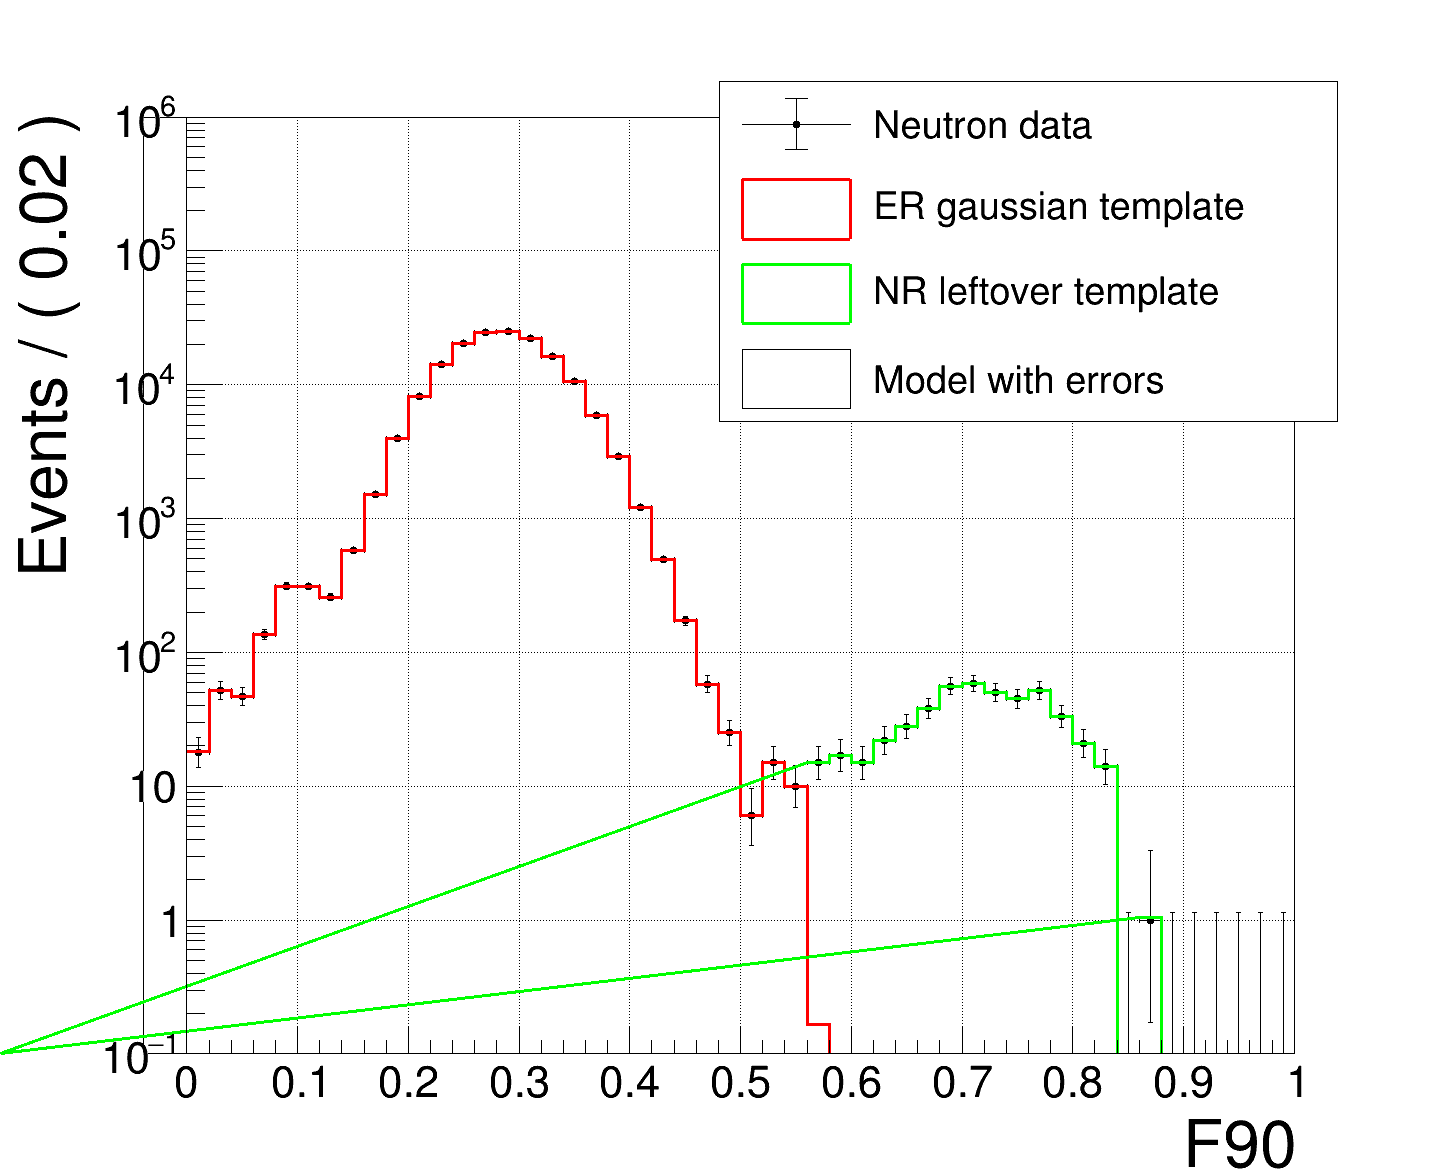
RooPlot *xframe02 = f90.frame(Title("RooFit fit"));
hdata_neutron.plotOn(xframe02, Name("Data"));
model.plotOn(xframe02, VisualizeError(*fit_result_neutron, 1), Name("Model with errors"));
hdata_neutron.plotOn(xframe02);
// model.paramOn(xframe02, Layout(0.55));
model.plotOn(xframe02, Name("ER gauss"), Components(pdf_parmetrized_histo_bkg), LineColor(kRed));
model.plotOn(xframe02, Name("NR template"), Components(pdf_parametrized_histo_sig), LineColor(kGreen));
xframe02->SetTitle("");
xframe02->SetMinimum(1e-1);
xframe02->SetMaximum(1e6);
xframe02->Draw();
c03->SetLogy();
c03->SetGridx();
c03->SetGridy();
c03->Modified();
c03->Update();
TLegend *leg03 = new TLegend(0.50, 0.64, 0.93, 0.93);
leg03->AddEntry("Data", "Neutron data", "LEP");
leg03->AddEntry("ER gauss", "ER gaussian template", "F");
leg03->AddEntry("NR template", "NR leftover template", "F");
// leg03->AddEntry("Model with errors", "Model with errors", "F");
leg03->SetTextSize(0.035);
leg03->Draw();
c03->SetLeftMargin(0.13);
if (SavePlots) {c03->SaveAs((OutputPath + "Combined_ER_and_NR_pdf_fit_in_neutron_data_Bin_" + std::to_string(bin_nr) + "." + PlotFileType).c_str()); }
Some of the entries of the components are manually set to zero. At first I thought maybe this causes an issue on the log-scale. But setting it to 0.00001 instead still leads to the same problem. So I am a bit clueless and any help would be well appreciated