Hi all,
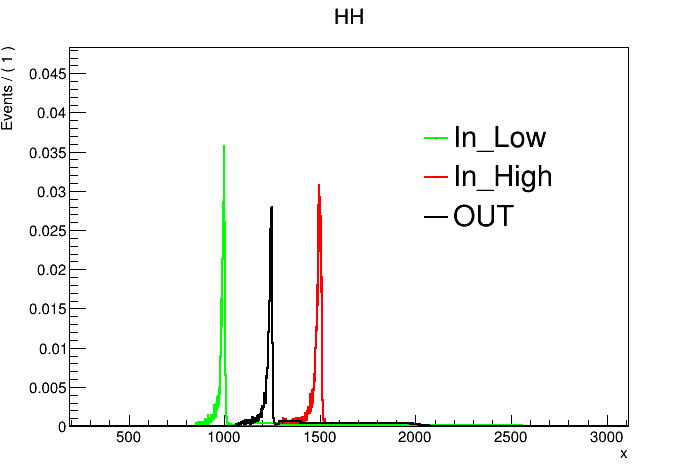
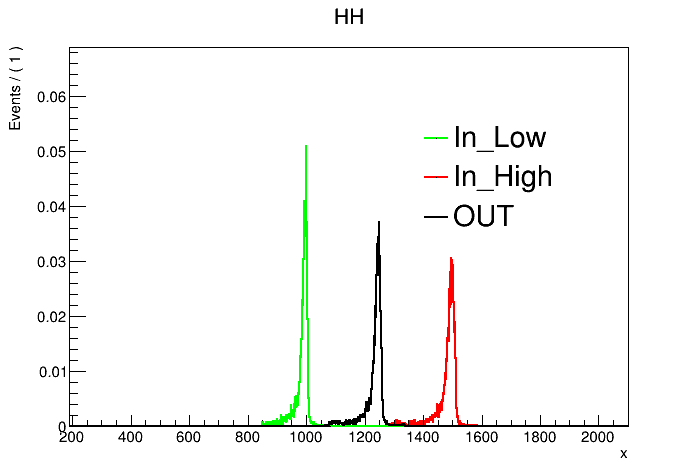
I am attempting to interpolate between two known histograms to produce a shape between them. I am running into a problem where the output histogram has the correct shape but the height and integral are less than either of the input histograms. The problem is illustrated in the attached photo, you will see the black histogram which was produced by interpolating between the red and green histograms.
I am also attaching the code that made this with the caveat that it is not a completely working example as attached. This is part of a much larger code and reads in MC Signal files which I am unable to share at this time. If this is not enough to solve the issue, let me know and I can try to create a short version of the code.
The interpolation is on lines 74-81, which I will copy below:
    RHL = ROOT.RooDataHist("HL_".format(un), ";DiCluster Mass [GeV];Events/GeV", ROOT.RooArgList(self._x), HL)
    RHLR = ROOT.RooHistPdf("HL_AbsReal_{}".format(un), "", ROOT.RooArgSet(self._x), RHL)
    RHH = ROOT.RooDataHist("HH_{}".format(un), ";DiCluster Mass [GeV];Events/GeV", ROOT.RooArgList(self._x), HH)
    RHHR = ROOT.RooHistPdf("HH_AbsReal_{}".format(un), "", ROOT.RooArgSet(self._x), RHH)

    RHIM = ROOT.RooIntegralMorph("Hmorph_{}".format(un), "", RHHR, RHLR, self._x, rmass)
    self.xframe = self._x.frame(ROOT.RooFit.Title(";DiCluster Mass [GeV];Events/GeV"), ROOT.RooFit.Range(0, 10000))
    RHI = RHIM.createHistogram("Hinterpo_{}".format(un), self._x)
The lines after this (85 - 107) plot the output of this and produce the attached plot. As you can see, I am exactly plotting the two input and output histograms and for some reason the output does not seem to make sense, it would seem impossible that the interpolation would produce a histogram that is lower in height than either of the two input histograms.
Thank you in advance for you help, let me know if there are other questions I can answer