Hi, I want to draw the LaTeX \ell on a plot done by ROOT.
Following the convention in which the backslash is substituted with “#” before LaTeX syntax I wrote:
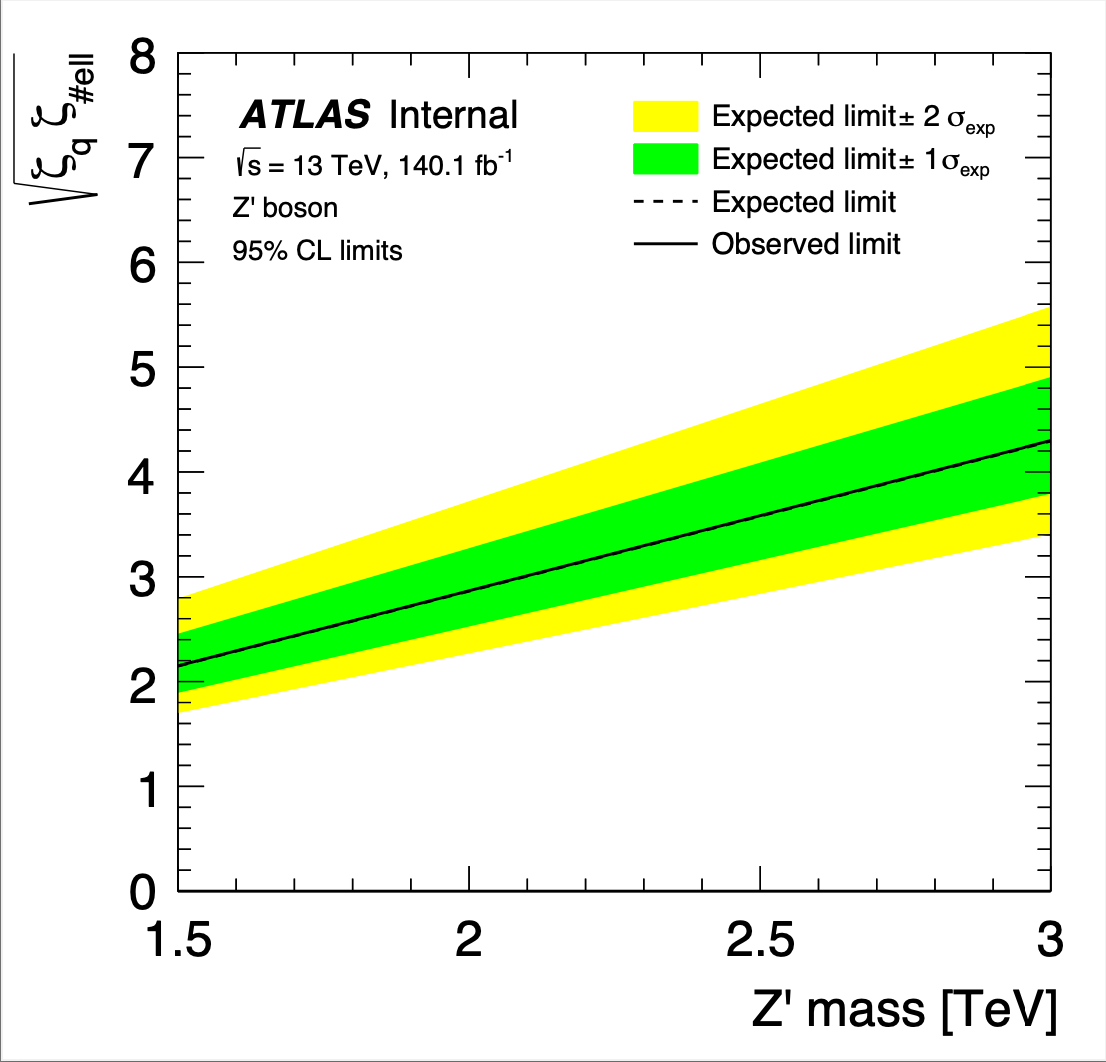
y_title["VLQ_GEN_zp33LL"] = "#sqrt{#zeta_{q} #zeta_{#ell}}"
However this is failing, see the attached figure, while the syntax for the other commands (e.g. #sqrt , #zeta ) is working. Can you give any help?
Thanks, best,
I run with:
python3 contour_plot.py -o /afs/cern.ch/user/g/gpadovan/eos/www/ongoing/2025-01-27_unblinded-limits/
The command:
python3 --version
yields:
Python 3.9.21
The command:
root --version
yields:
ROOT Version: 6.34.02

Built for linuxx8664gcc on Jan 15 2025, 00:00:00

From tags/6-34-02@6-34-02
yus
January 27, 2025, 12:26pm
2
Hi Giovanni,\\ell instead of #ell.
Hi,
the string
y_title["VLQ_GEN_zp33LL"] = "#sqrt{#zeta_{q} #zeta_{\\ell}}"
yields different results in .png and .pdf (this is quite strange!)
In the .png I get this (the string is messed up):
In the .pdf I get this (no variation):
Is there anything els I can do?
Thanks,
yus
January 27, 2025, 12:34pm
4
Yeah, I don’t think the \\ell thing is supposed to work in PDFs unfortunately, see the latest replies at \ell symbol in PDF and \ell symbol in TH1 axis .# with \\.
couet
January 28, 2025, 9:10am
5
ell is supported only by TMathText and TMathText is not supported by TPdf. You might consider using web graphics.