I want to add an axis on the right, how do I do it?

Hi.
I’d like to add an axis to the right.
I would like to draw the signal graph shown in the picture together by adding an axis to the right of the bkg graph.
I tried following the code in the example, but I can’t apply it well. Can you kindly provide me with a solution?
Attached is my code for your reference.


code.pdf (23.3 KB)

Dear @hyuna,

Have you already taken a look at similar posts, such as this one? There is also a tutorial that might help.

Let me know if you are still stuck,
Vincenzo

hist1->Draw("same Y+");

might work …

Hi.
Thanks for your kind reply.
I did it according to the tutorial, and I did it the way you.
But signal and bkg graphs are not drawn together.
The left y-axis just moves to the right.
I mean, I want to set the y-axis scale on the right side of the signal with the same x-axis.

This examaple might help:

{
   TCanvas *c1 = new TCanvas("c1","c1",600,600);
   TPad *pad1 = new TPad("pad1","",0,0,1,1);
   TPad *pad2 = new TPad("pad2","",0,0,1,1);
   pad2->SetFillStyle(4000); //will be transparent
   pad2->SetFrameFillStyle(0);
   gStyle->SetOptStat(0);

   TH2F *h1 = new TH2F("h1","  ",40,-4,4,40,-4,4);
   TH2F *h2 = new TH2F("h2","  ",40,-40,40,40,-40,40);
   Double_t a,b;
   for (Int_t i=0;i<5000;i++) {
      gRandom->Rannor(a,b);
      h1->Fill(a-1.5,b-1.5);
      h2->Fill(10*a+1.5,10*b+1.5);
   }

   pad1->Draw();
   pad1->cd();
   h1->Draw("BOX");

   pad2->Draw();
   pad2->cd();
   h2->SetLineColor(kRed);
   h2->Draw("BOX X+Y+");
}

Thank you for reply.
I tried to understand the code you told me, but I didn’t.
I’m using TH1F, not TH2F.
And as you saw the code I attached, I defined 7 histogram with TH1F.
Therefore, I will import 7 root files using std::string.
So I don’t have to define a scale separately.
I tried the method you told me, but the code is not reading the root file I want to import.
I’m sorry I didn’t understand well.
There’s a code I used for practice.
Can you take a look?
This picture comes out when you turn the practice code.

void tt() {

TChain chain1(“B_tree”);
std::string file_1 = “/home/belle2/hyuna/Signal.root”;
chain1.Add(file_1.c_str());

TChain chain2(“B_tree”);
std::string file_2 = “/home/belle2/hyuna/test_job6/charged.root”;
chain2.Add(file_2.c_str());

TCanvas *c1 = new TCanvas();
TPad *pad1 = new TPad(“pad1”,“”,0,0,1,1);
TPad *pad2 = new TPad(“pad2”,“”,0,0,1,1);
pad2->SetFillStyle(4000);
pad2->SetFrameFillStyle(0);
gStyle->SetOptStat(0);

TH1F *h1 = new TH1F(“signal”,“signal”,200,5.2,5.29);
TH1F *h2 = new TH1F(“charged”,“charged”,200,5.2,5.29);

THStack hs1 = new THStack(“BtoK+gg”," BtoK+gg");
chain1.Draw(“Mbc >> signal”, “”);
chain2.Draw(“Mbc >> charged”, "(387.110^6/((1.810^5)(1+(0.5346/0.5654))))");
hs1->Add(h2);

pad1->Draw();
pad1->cd();
h2->Draw(“h”);

pad2->Draw();
pad2->cd();
h1->SetLineColor(kRed);
h1->Draw(“same Y+”);
}

I see you get a 2nd scale on right different for the one on left. Is it not what you where looking for ?

Axis is made of two, but the problem is that the bkg and signal scale that I first uploaded are not coming out well.
I want to draw a plot with different yaxis with each data as shown in the picture, but I think my data overlaps and it’s not drawing properly.
I just want to draw a full signal history on a bkg stack.
It means that I want to read independent data like the picture below and draw it together in the same space.

${ROOTSYS}/tutorials/hist/transpad.C
${ROOTSYS}/tutorials/hist/twoscales.C

BTW. You can also modify the macro which created the picture you show to use histograms instead of graphs.

Hi.
I solved the problem so far.
One thing I’m curious about is where should I use TLegend to get color bar information?
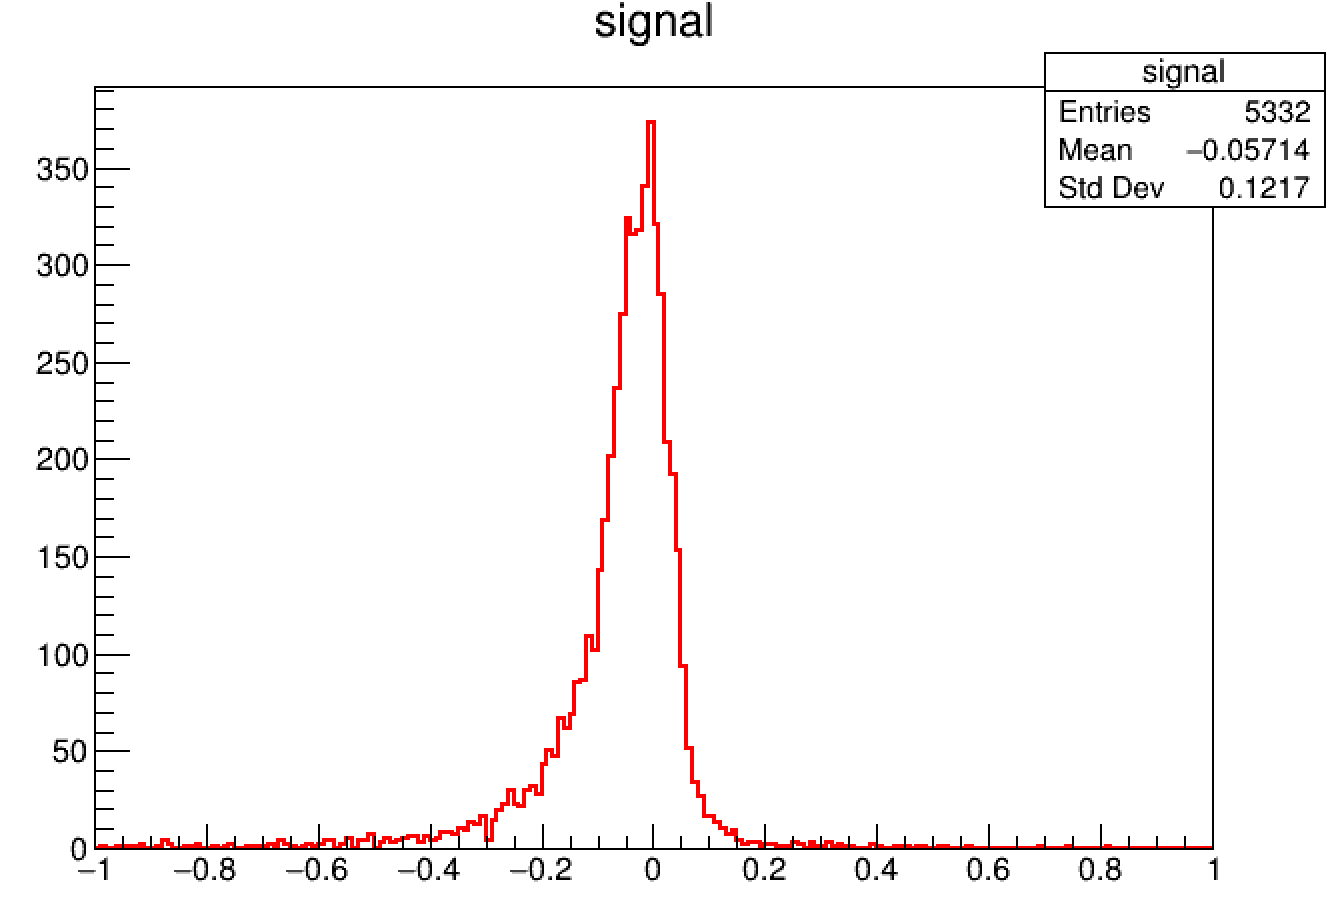
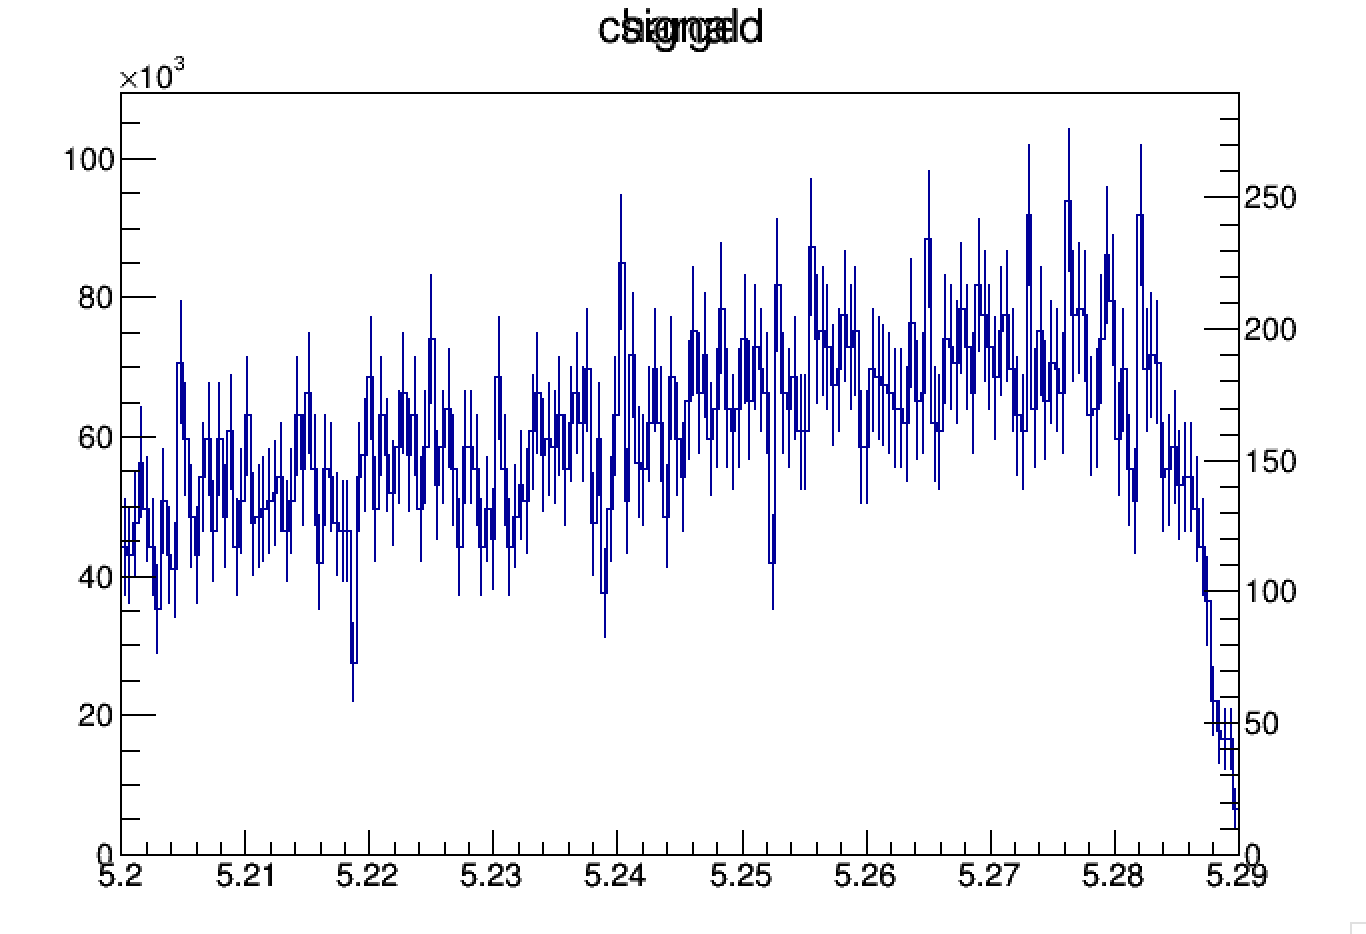
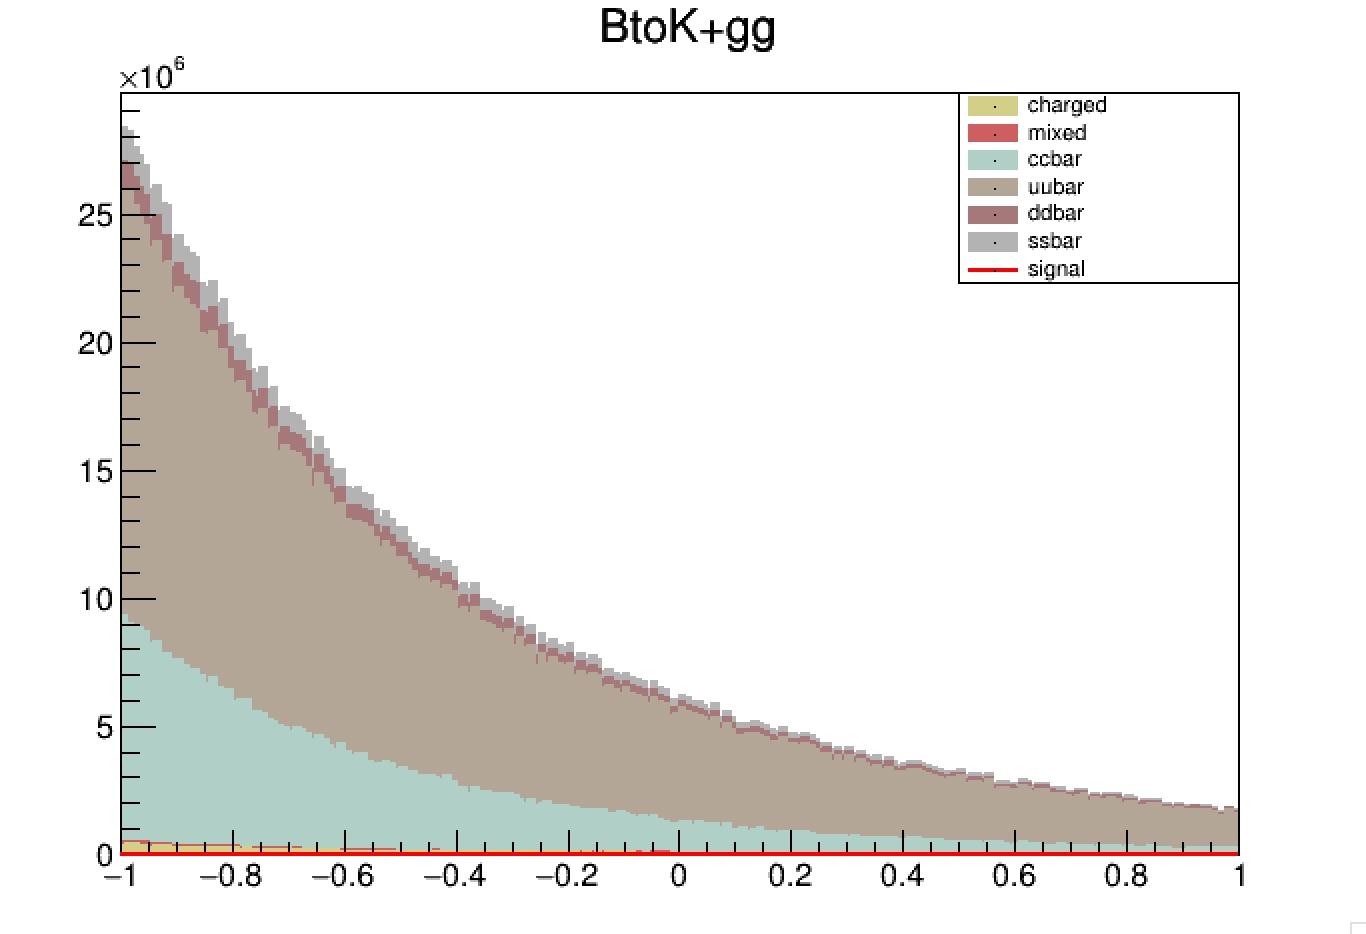
Before I drew bkg+signal histograms, when I drew bkg and signal respectively, I showed color bar information like the picture below.

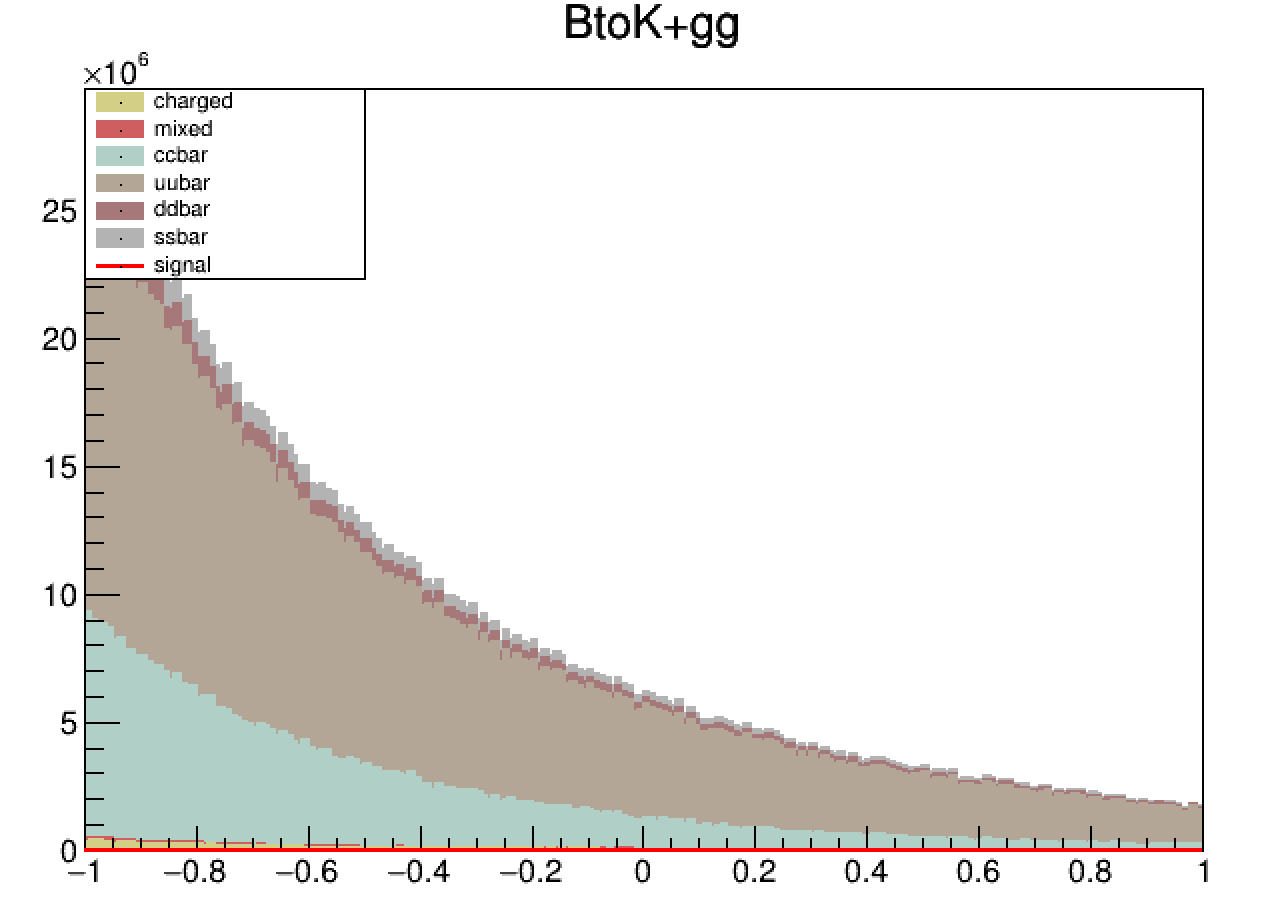
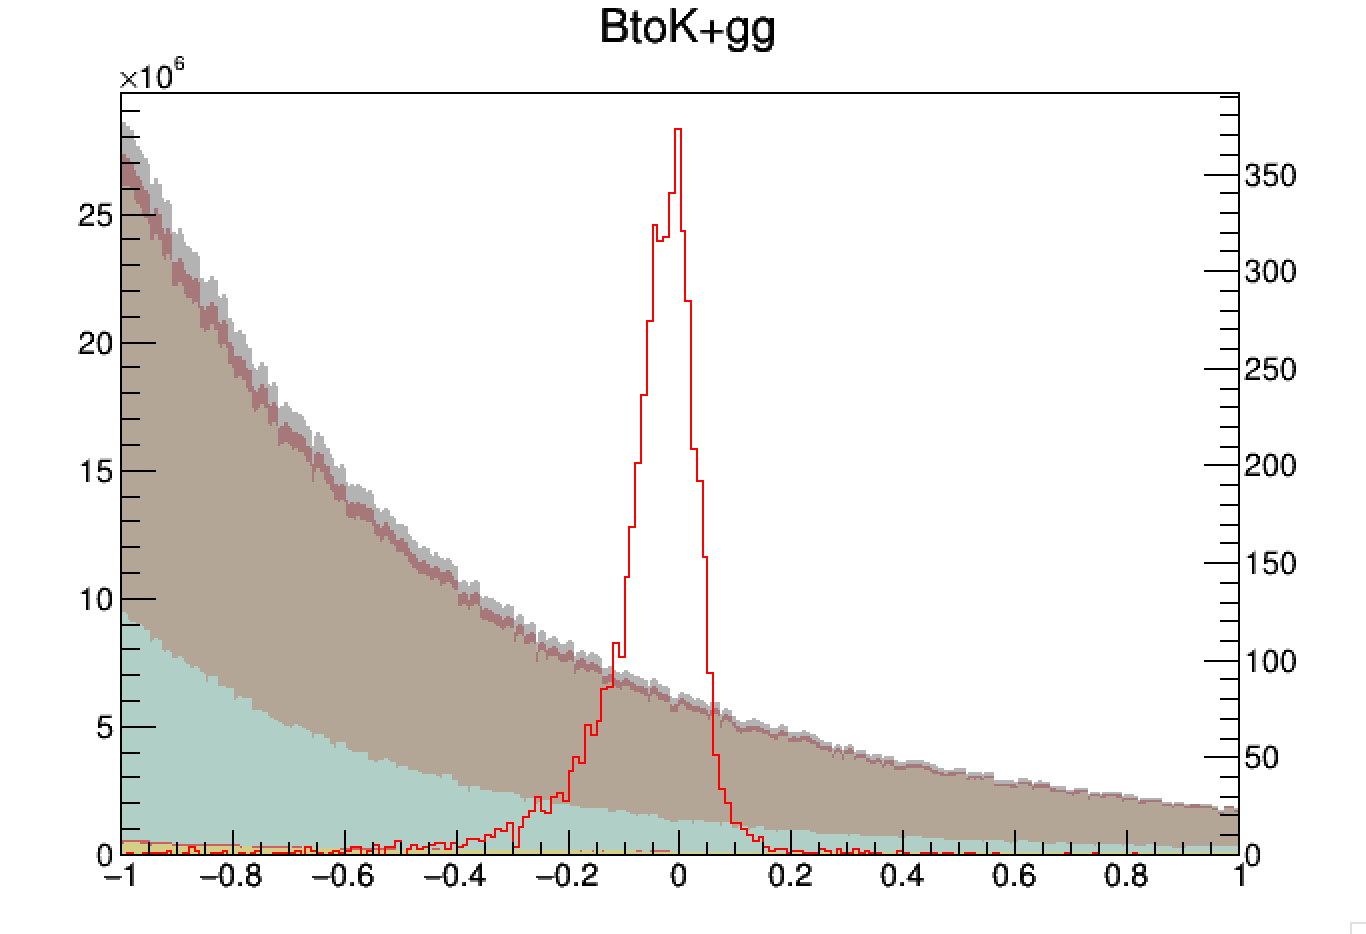
However, when I drew bkg+signal histogram, color bar information was not generated even if I put TLegend anywhere.
Like the picture below.

I will attach my code together for your reference.
If you know the solution, please let me know.

void tt_d() {

 TChain chain1("B_tree");
 std::string file_1 = "/home/belle2/hyuna/Signal.root";
 chain1.Add(file_1.c_str());

 TChain chain2("B_tree");
 std::string file_2 = "/home/belle2/hyuna/test_job6/charged.root";
 chain2.Add(file_2.c_str());

 TChain chain3("B_tree");
 std::string file_3 = "/home/belle2/hyuna/test_job7/mixed.root";
 chain3.Add(file_3.c_str());

 TChain chain4("B_tree");
 std::string file_4 = "/home/belle2/hyuna/test_job8/ccbar.root";
 chain4.Add(file_4.c_str());

 TChain chain5("B_tree");
 std::string file_5 = "/home/belle2/hyuna/test_job9/uubar.root";
 chain5.Add(file_5.c_str());

 TChain chain6("B_tree");
 std::string file_6 = "/home/belle2/hyuna/test_job10/ddbar.root";
 chain6.Add(file_6.c_str());

 TChain chain7("B_tree");
 std::string file_7 = "/home/belle2/hyuna/test_job11/ssbar.root";
 chain7.Add(file_7.c_str());

 TCanvas *c1 = new TCanvas();
 TPad *pad1 = new TPad("pad1","",0,0,1,1);
 TPad *pad2 = new TPad("pad2","",0,0,1,1);
 pad2->SetFillStyle(4000);
 pad2->SetFrameFillStyle(0);
 gStyle->SetOptStat(0);

 TH1F *h1 = new TH1F("signal","",200,-1.0,1.0);
 TH1F *h2 = new TH1F("charged","charged",200,-1.0,1.0);
 TH1F* h3 = new TH1F("mixed","mixed",200,-1.0,1.0);
 TH1F* h4 = new TH1F("ccbar","ccbar",200,-1.0,1.0);
 TH1F* h5 = new TH1F("uubar","uubar",200,-1.0,1.0);
 TH1F* h6 = new TH1F("ddbar","ddbar",200,-1.0,1.0);
 TH1F* h7 = new TH1F("ssbar","ssbar",200,-1.0,1.0);

 THStack *hs1 = new THStack("BtoK+gg"," BtoK+gg");
// chain1.Draw("Mbc >> signal", "");
 chain2.Draw("deltaE >> charged", "(387.1*10^6/((1.8*10^5)*(1+(0.5346/0.5654))))");
 chain3.Draw("deltaE >> mixed", "(387.1*10^6/((1.8*10^5)*(1+(0.5346/0.5654))))*(0.5346/0.5654)");
 chain4.Draw("deltaE >> ccbar", "(387.1*10^6/((1.8*10^5)*(1+(0.5346/0.5654))))*(1.329/0.5654)");
 chain5.Draw("deltaE >> uubar", "(387.1*10^6/((1.8*10^5)*(1+(0.5346/0.5654))))*(1.605/0.5654)");
 chain6.Draw("deltaE >> ddbar", "(387.1*10^6/((1.8*10^5)*(1+(0.5346/0.5654))))*(0.401/0.5654)");
 chain7.Draw("deltaE >> ssbar", "(387.1*10^6/((1.8*10^5)*(1+(0.5346/0.5654))))*(0.383/0.5654)");

 TLegend* legend = gPad->BuildLegend(0.1,0.7,0.3,0.9);

 hs1->Add(h2); h2->SetLineStyle(1); h2->SetLineWidth(2); h2->SetLineColor(41); h2->SetFillColor(41);
 hs1->Add(h3); h3->SetLineStyle(1); h3->SetLineWidth(2); h3->SetLineColor(46); h3->SetFillColor(46);
 hs1->Add(h4); h4->SetLineStyle(1); h4->SetLineWidth(2); h4->SetLineColor(29); h4->SetFillColor(29);
 hs1->Add(h5); h5->SetLineStyle(1); h5->SetLineWidth(2); h5->SetLineColor(24); h5->SetFillColor(24);
 hs1->Add(h6); h6->SetLineStyle(1); h6->SetLineWidth(2); h6->SetLineColor(48); h6->SetFillColor(48);
 hs1->Add(h7); h7->SetLineStyle(1); h7->SetLineWidth(2); h7->SetLineColor(16); h7->SetFillColor(16);

// TLegend* legend = gPad->BuildLegend(0.1,0.7,0.3,0.9);

 pad1->Draw();
 pad1->cd();
 hs1->Draw("h");

 pad2->Draw();
 pad2->cd();
 chain1.Draw("deltaE >> signal", "");
 h1->SetLineColor(kRed);
 h1->Draw("Y+");

 c1 -> SaveAs("bkg_signal_deltaE.png");

}
hs1->Draw();
TLegend *legend = gPad->BuildLegend(0.1, 0.7, 0.3, 0.9);
gPad->Modified(); gPad->Update();

Thank you for your kind reply.
I solved the problem thanks to you.
Have a nice day @Wile_E_Coyote - ̗̀( ˶’ᵕ’˶ ) ̖́-

This topic was automatically closed 14 days after the last reply. New replies are no longer allowed.