Hi,
I’m trying to overlay two histograms with two y-axes in a manner similar to http://root.cern.ch/root/html/tutorials/hist/twoscales.C.html. My problem is how to get log scales to work using this method. When I turn on log scale the overlayed histograms points and the 2nd y-axis no longer properly correspond.
Here is a simple macro to show the effect:
TCanvas *c1;
TH1D *h1, *h2;
TGaxis *ax1;
void t3()
{
const Int_t nbinX = 5;
Double_t hX[nbinX + 1] = {0., 1., 2., 3., 4., 5.};
Double_t h1Y[nbinX] = {100000., 10000., 1000., 100., 10.};
// first histogram
h1 = new TH1D("h1", "h1", nbinX, hX);
h1->SetStats(kFALSE);
for (Int_t i = 1; i < nbinX + 1; i++)
h1->SetBinContent(i, h1Y[i - 1]);
// second histogram to overlay
Double_t h2Y[nbinX] = {2, 10, 100, 1000, 10000};
h2 = new TH1D("h2", "h2", nbinX, hX);
h2->SetStats(kFALSE);
h2->SetMarkerStyle(kFullCircle);
for (Int_t i = 1; i < nbinX + 1; i++)
h2->SetBinContent(i, h2Y[i - 1]);
c1 = new TCanvas("c1", "c1");
h1->Draw();
c1->Update();
Double_t h2min = h2->GetMinimum();
Float_t rightmax = 1.1*h2->GetMaximum();
Float_t scale = gPad->GetUymax()/rightmax;
h2->Scale(scale);
h2->Draw("p same");
ax1 = new TGaxis(gPad->GetUxmax(), gPad->GetUymin(),
gPad->GetUxmax(), gPad->GetUymax(),
h2min, rightmax, 510, "+LG");
ax1->Draw();
c1->SetLogy();
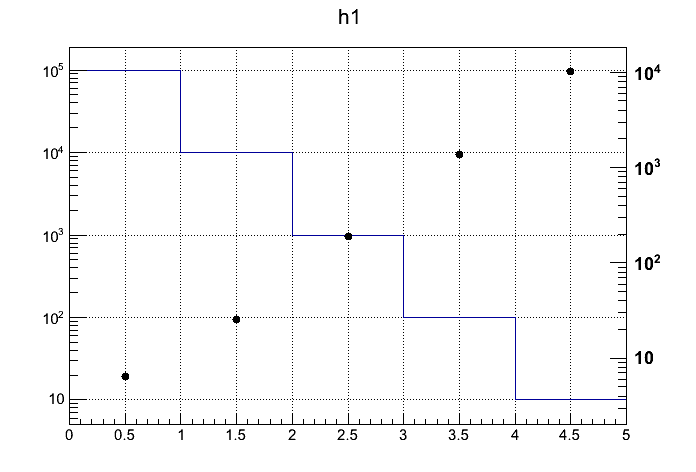
}The solid histogram and y-axis on the left (h1) are correct, the points and the y-axis on the right (h2) are not correct. The points should be at 2, 10, 100, 1000, 10000, but they are slightly off.
How does one properly do this?