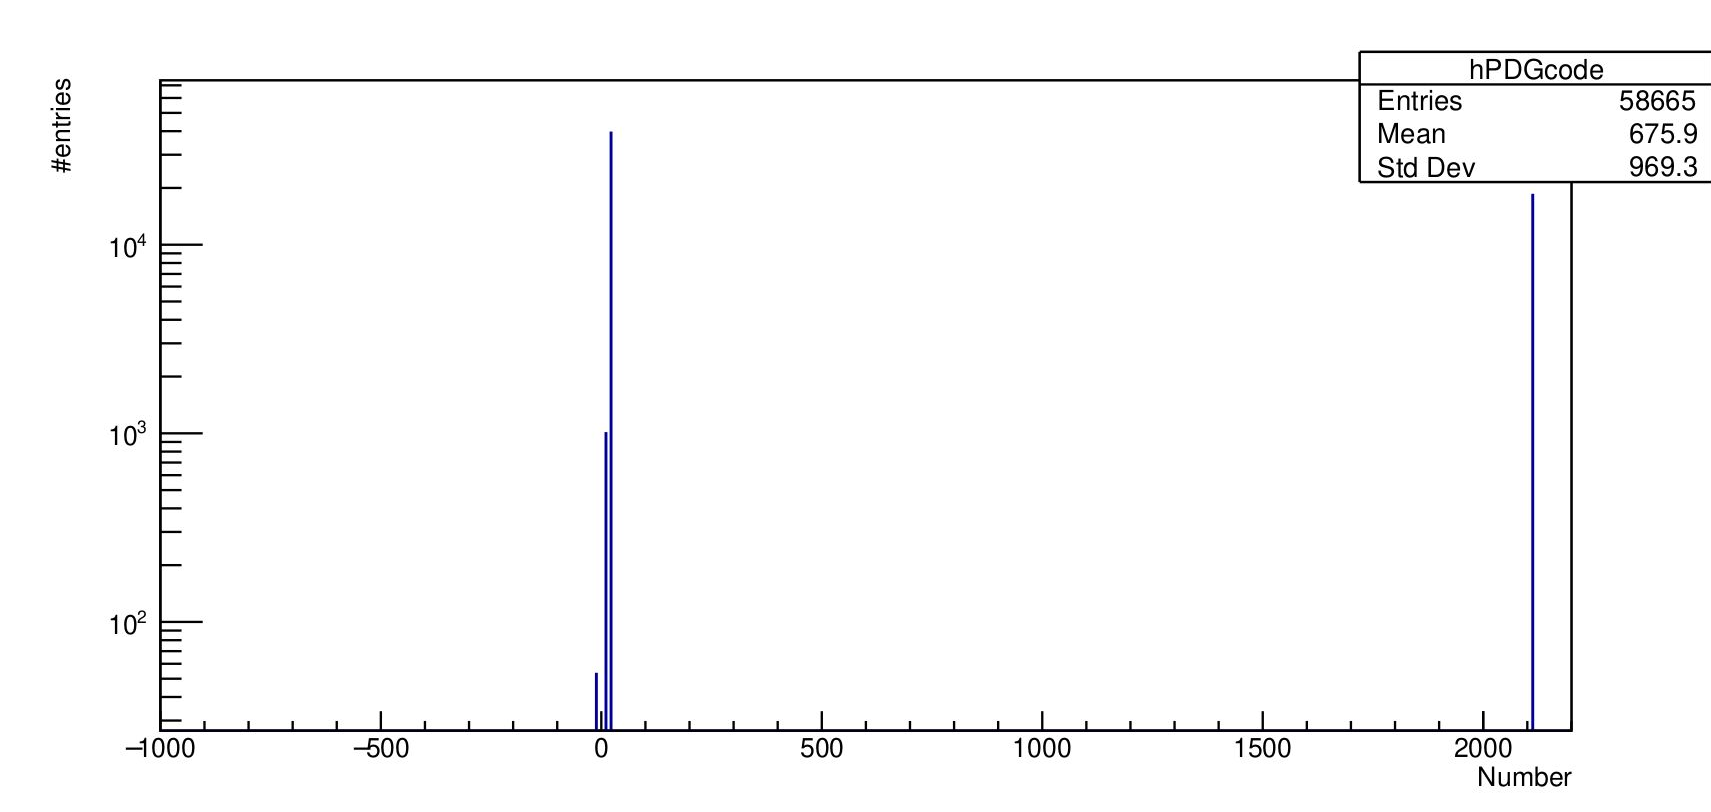
Here in the attachment, I have a macro used, and I want in the last part of the code in drawing PDG code (Particle ID ) I have bars represents 4 Particle IDs ( -11, 11, 22, 2112) appears in PDF, and I want to Draw this on Logarithmic scale, and I could not do it. And I got errors when I tried by adding SetLogx() and axis limit, so where is the problem.
ParticleID.pdf (14.6 KB) Out_run_0.root (10.2 KB) DrawHistogramsOriginal.cpp (3.6 KB)ParticleID.pdf (14.3 KB)