void two_gaus_fit()
{
Double_t x[128] = { 0.2244898, 0.2326531, 0.2408163, 0.2489796, 0.2530612, 0.2571429, 0.2612245, 0.2653061, 0.2693878, 0.2734694, 0.277551, 0.2816327, 0.2857143, 0.2897959, 0.2938776, 0.2979592, 0.3020408,
0.3061224, 0.3102041, 0.3142857, 0.3183673, 0.322449, 0.3265306, 0.3306122, 0.3346939, 0.3387755, 0.3428571, 0.3469388, 0.3510204, 0.355102, 0.3591837, 0.3632653, 0.3673469,
0.3714286, 0.3755102, 0.3795918, 0.3836735, 0.3877551, 0.3918367, 0.3959184, 0.4, 0.4040816, 0.4081633, 0.4122449, 0.4163265, 0.4204082, 0.4244898, 0.4285714, 0.4326531,
0.4367347, 0.4408163, 0.444898, 0.4489796, 0.4530612, 0.4571429, 0.4612245, 0.4653061, 0.4693878, 0.4734694, 0.477551, 0.4816327, 0.4857143, 0.4897959, 0.4938776, 0.4979592,
0.5020408, 0.5061224, 0.5102041, 0.5142857, 0.5183673, 0.522449, 0.5265306, 0.5306122, 0.5346939, 0.5387755, 0.5428571, 0.5469388, 0.5510204, 0.555102, 0.5591837, 0.5632653,
0.5673469, 0.5714286, 0.5755102, 0.5795918, 0.5836735, 0.5877551, 0.5918367, 0.5959184, 0.6, 0.6040816, 0.6081633, 0.6122449, 0.6163265, 0.6204082, 0.6244898, 0.6285714,
0.6326531, 0.6367347, 0.6408163, 0.644898, 0.6489796, 0.6530612, 0.6571429, 0.6612245, 0.6653061, 0.6693878, 0.6734694, 0.677551, 0.6816327, 0.6857143, 0.6897959, 0.6938776,
0.6979592, 0.7020408, 0.7061224, 0.7102041, 0.7142857, 0.7183673, 0.722449, 0.7265306, 0.7306122, 0.7346939, 0.7387755, 0.7428571, 0.7469388, 0.7510204, 0.7673469 };
Double_t y[128] = { 0, 0.001, 0, 0.001, 0.001, 0.005, 0.005, 0.007, 0.01, 0.01, 0.011, 0.026, 0.023, 0.028, 0.075, 0.079, 0.118,
0.154, 0.232, 0.303, 0.344, 0.452, 0.549, 0.686, 0.882, 1.01, 1.214, 1.396, 1.69, 1.73, 2.082, 2.249, 2.391,
2.577, 2.946, 2.851, 2.915, 3.066, 3.177, 3.208, 3.335, 3.362, 3.367, 3.384, 3.383, 3.271, 3.272, 3.244, 3.195,
3.125, 2.885, 2.859, 2.788, 2.532, 2.367, 2.304, 2.162, 1.862, 1.717, 1.602, 1.3, 1.215, 1.104, 0.992, 0.869,
0.869, 0.993, 1.11, 1.216, 1.302, 1.605, 1.718, 1.874, 2.166, 2.304, 2.362, 2.545, 2.799, 2.856, 2.88, 3.113,
3.203, 3.25, 3.256, 3.286, 3.391, 3.371, 3.376, 3.363, 3.329, 3.202, 3.167, 3.068, 2.914, 2.858, 2.943, 2.569,
2.384, 2.251, 2.085, 1.725, 1.685, 1.398, 1.21, 1.009, 0.884, 0.679, 0.549, 0.452, 0.345, 0.3, 0.232, 0.156,
0.116, 0.079, 0.075, 0.028, 0.023, 0.026, 0.011, 0.01, 0.01, 0.007, 0.005, 0.005, 0.001, 0.001, 0.001 };
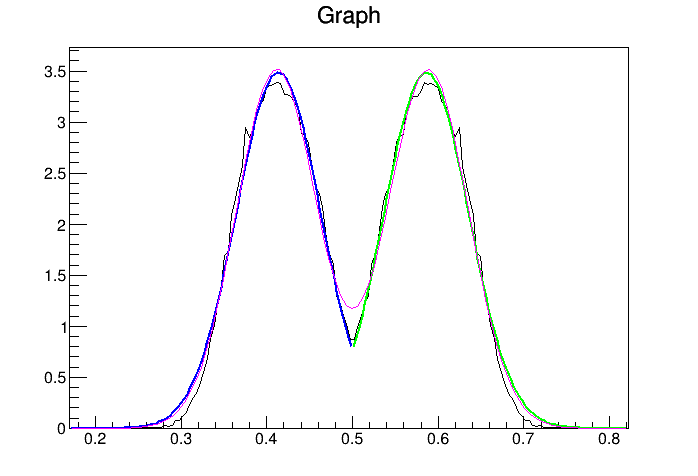
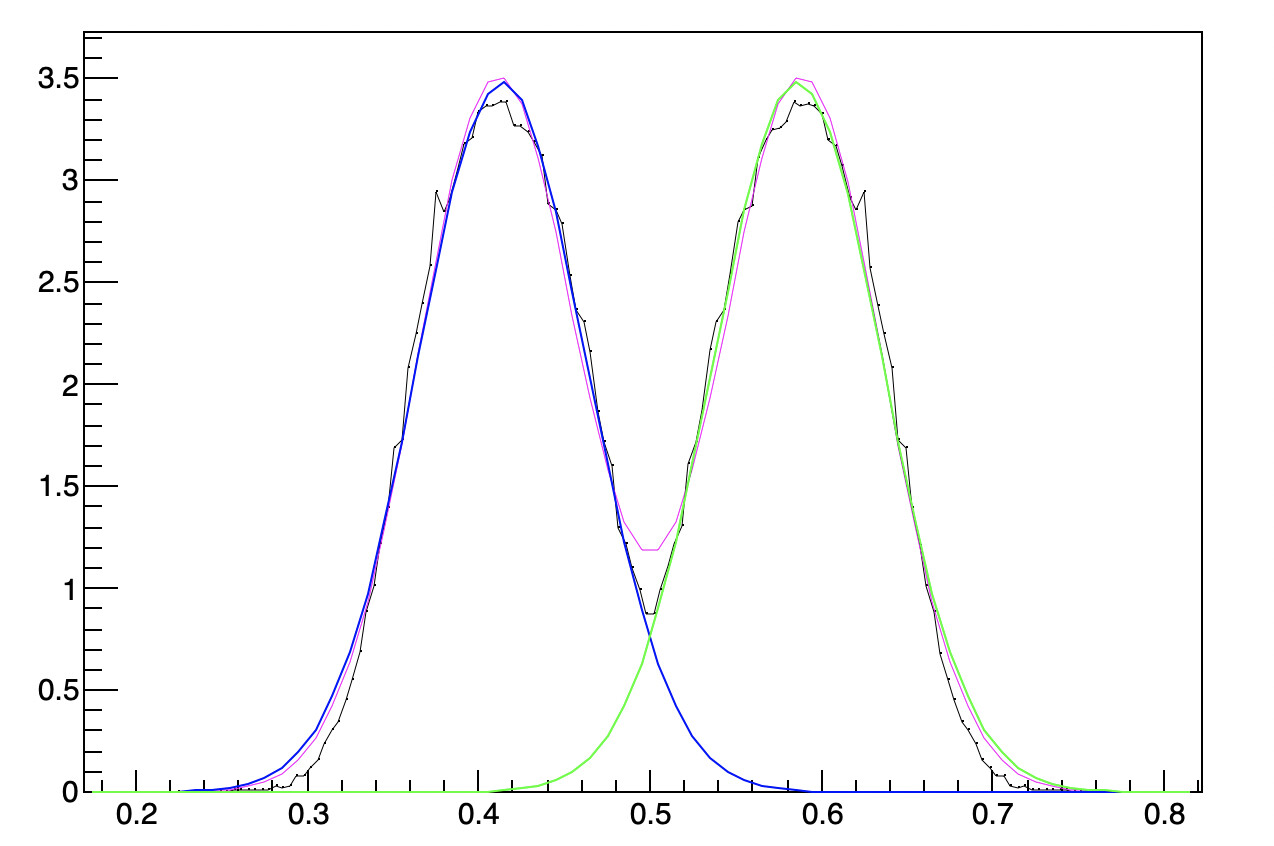
TGraph *graph = new TGraph(128,x,y);
graph->Draw("apl");
double par[6];
TF1 *f1 = new TF1("f1","gaus",0,0.5);
f1->SetLineColor(kBlue);
graph->Fit("f1","R0");
TF1 *f2 = new TF1("f2","gaus",0.5,1);
f2->SetLineColor(kGreen);
graph->Fit("f2","R+0");
TF1 *fit1 = new TF1("fit1", "gaus(0)+gaus(3)",0,1);
fit1->SetLineWidth(1);
fit1->SetLineColor(kMagenta);
f1->GetParameters(&par[0]);
f2->GetParameters(&par[3]);
fit1->SetParameters(par);
graph->Fit(fit1, "R+");
f1->SetRange(0.,1);
f1->Draw("same");
f2->SetRange(0.,1);
f2->Draw("same");
}