I was trying to do a 2D fit (of “m” and “errm”) but this is not coming out correctly.
To find out the reason behind this I want to plot the projection of “m” fit in the different binning of “errm”. so I am trying to do with following changes:
dataxy->plotOn(xframe, CutRange(“SB2”));
const double nData = dataxy->sumEntries(" ", “SB2”);
pdf.plotOn(xframe,Components(gauss),LineStyle(kDashed),LineColor(kRed), ProjWData(*dataxy), Normalization(nData, RooAbsReal::NumEvent), ProjectionRange(“SB2”));
if case you refer, Here is the folder that I am using: projection_2D.zip (646.5 KB)
I am not sure this is giving me the right result.
Please help me to sort it out.
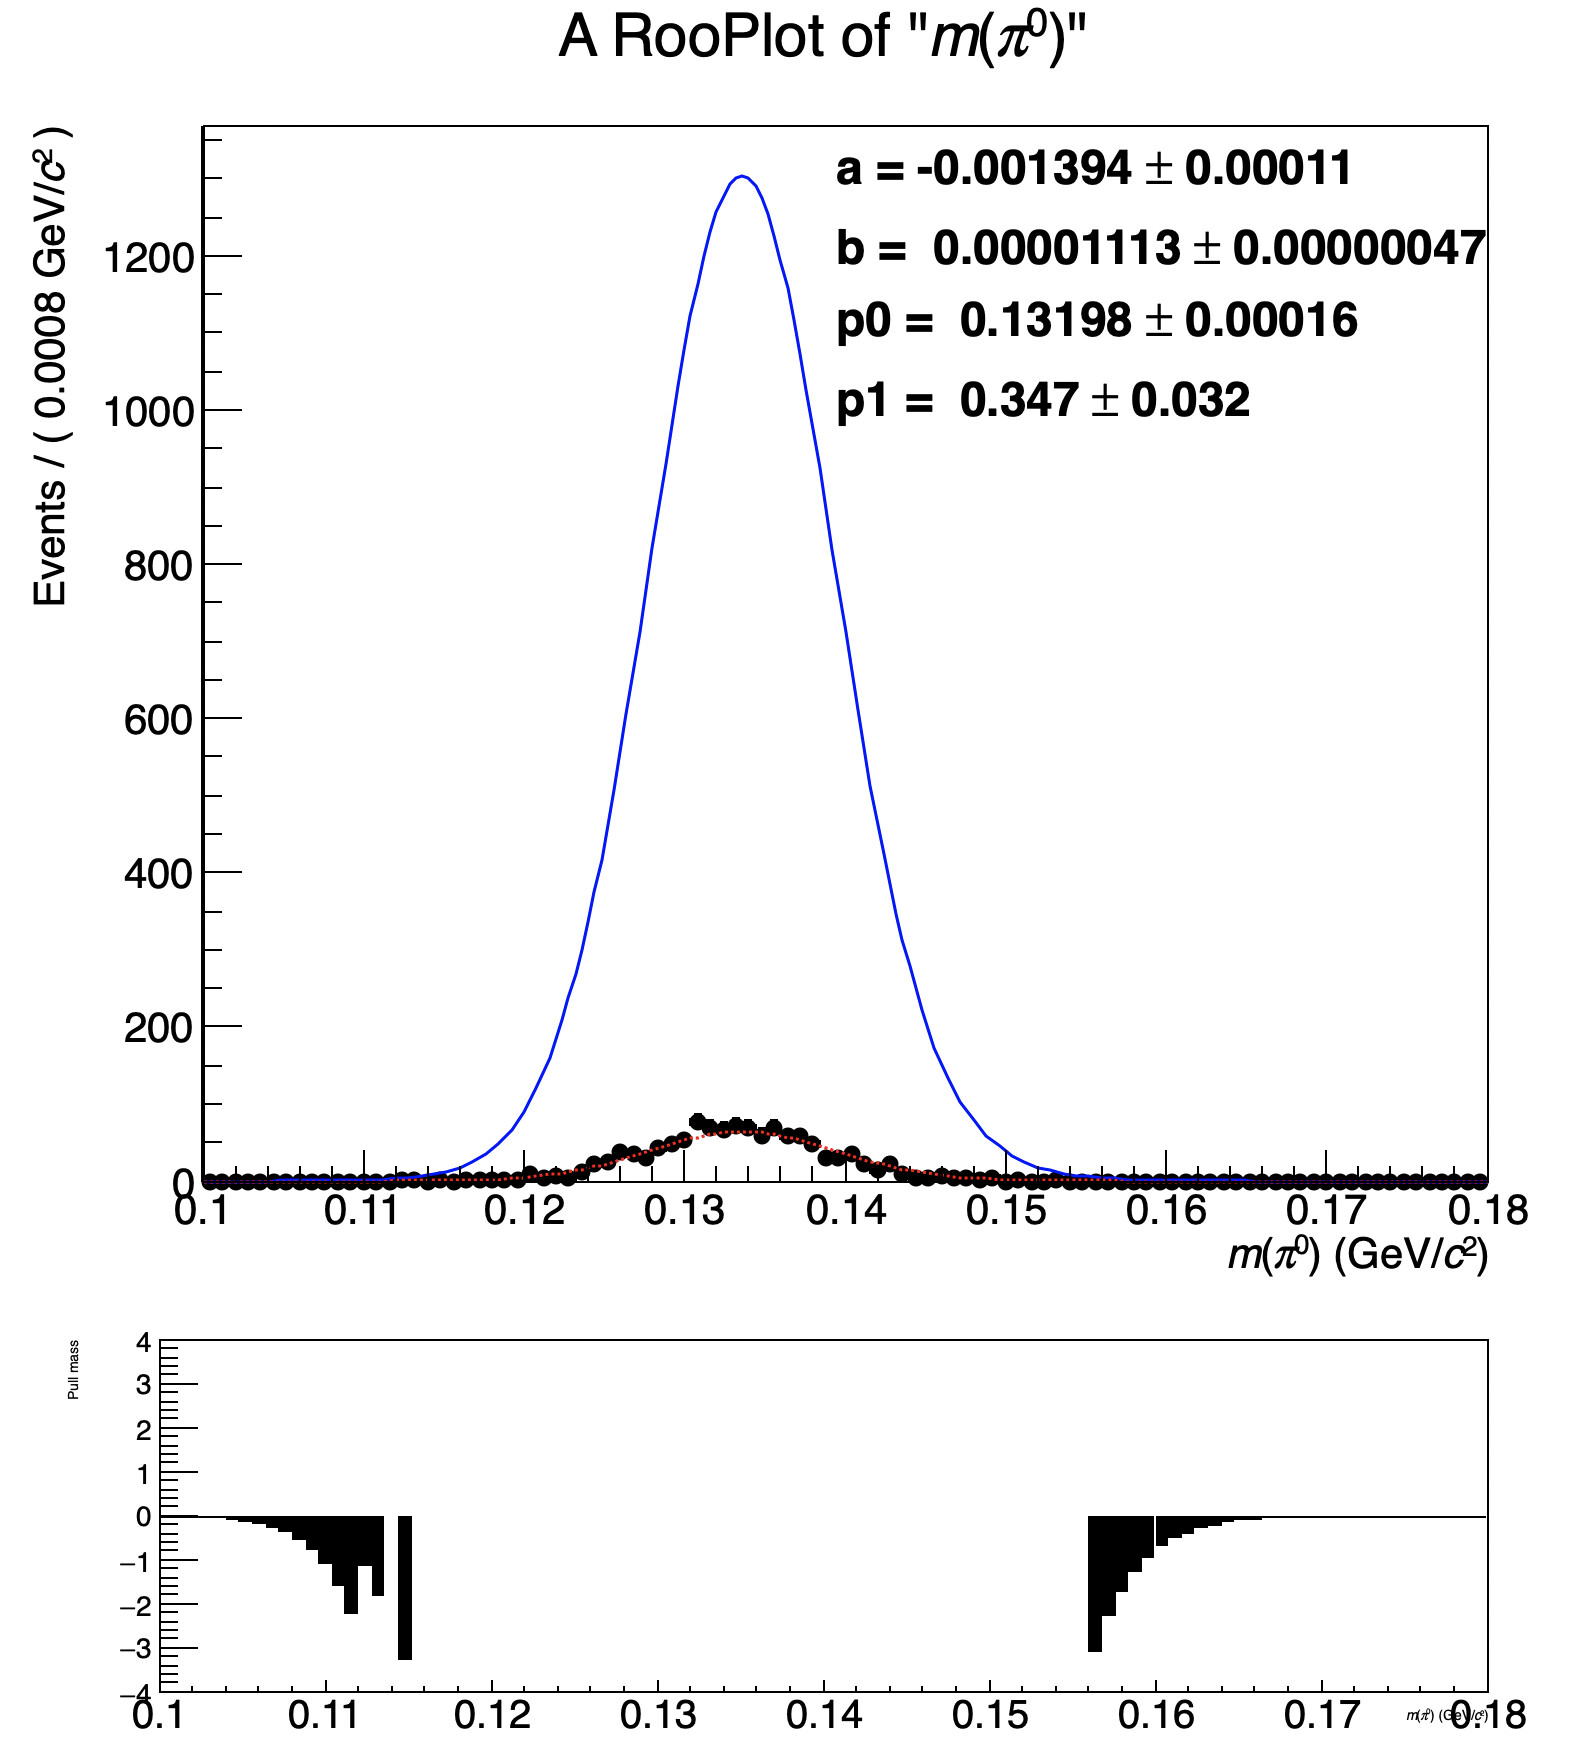
yes, Here I have tried to get the projection of “m” in the bin 0 to 0.0031 of “errm”.
but I think this is giving me total fit (blue) also and I am getting pull distribution for only a part of the range (left side and right side).
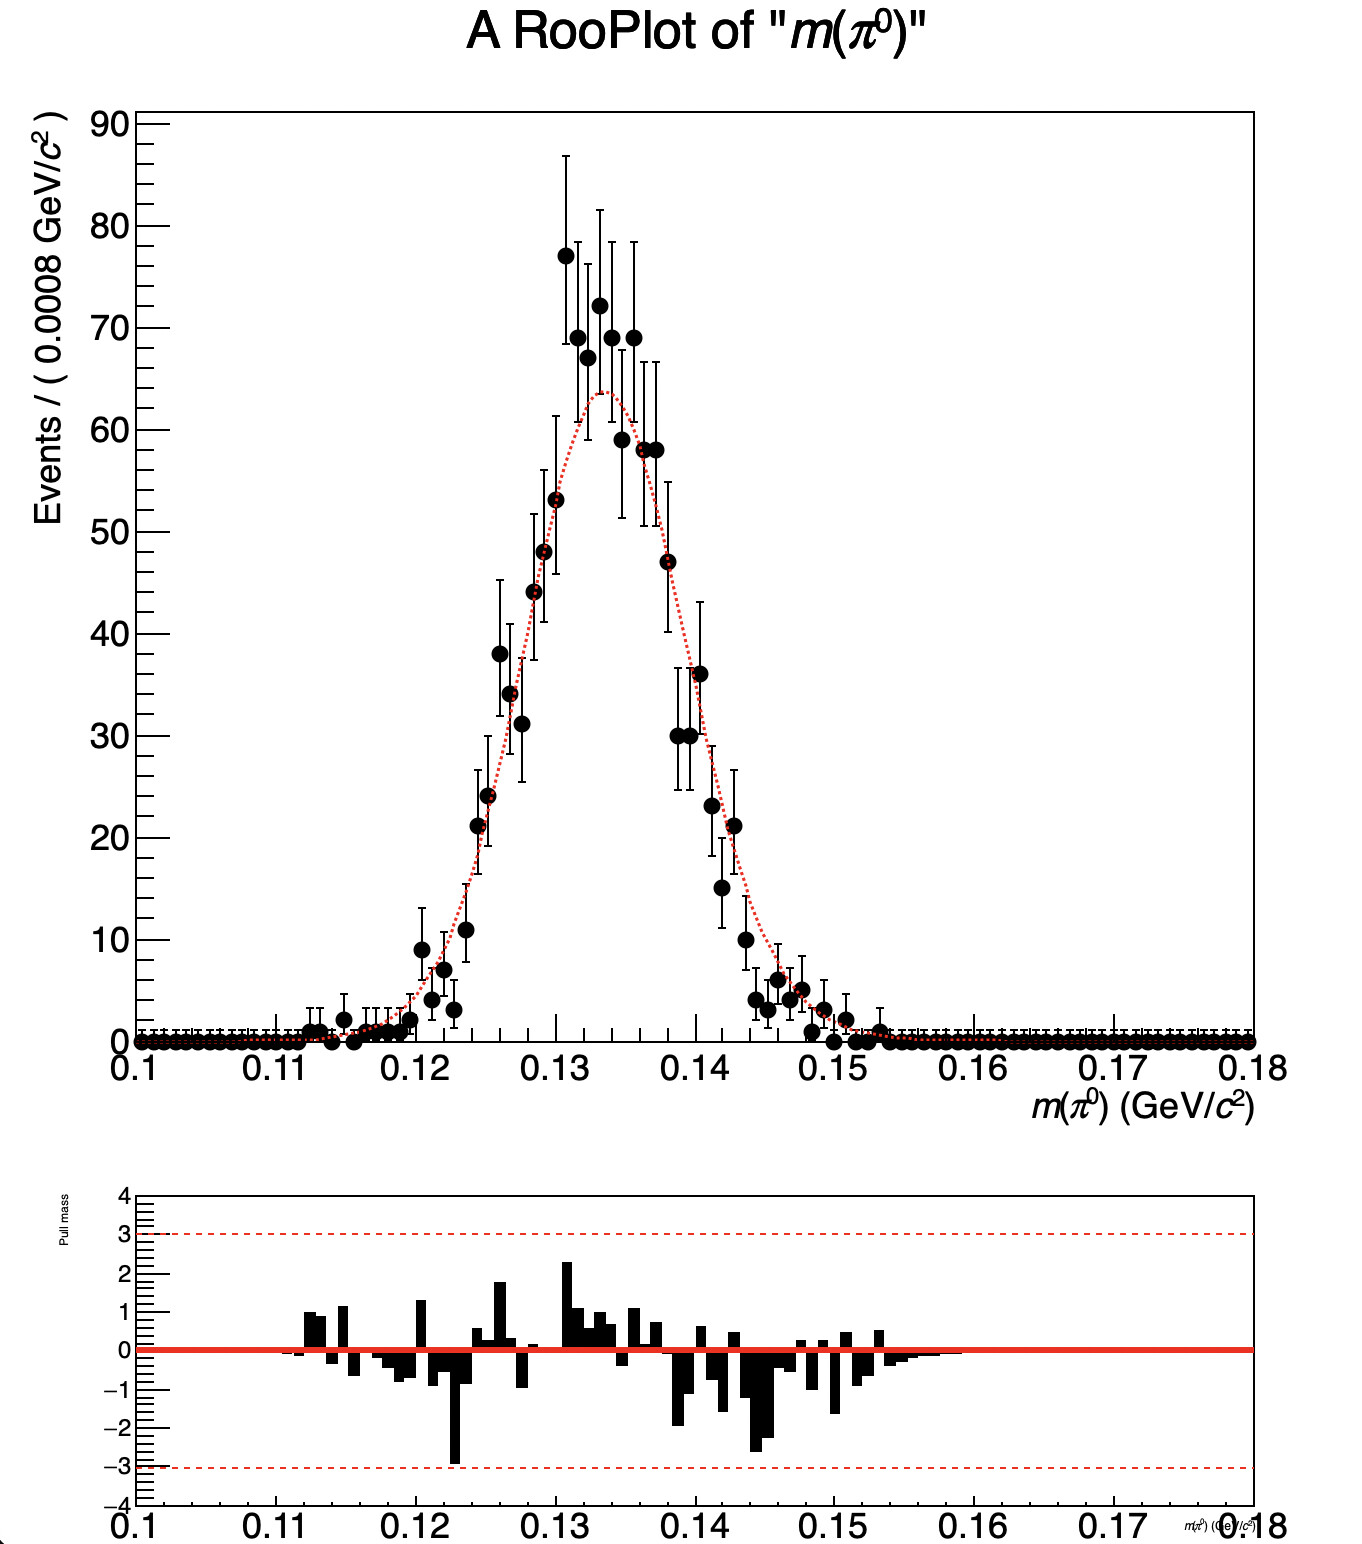
Hi, CutRange is not a valid option for plotting RooAbsPdf. You should use ProjectionRange
You might also need to provide the correct normalisation as written in ROOT: RooAbsData Class Reference in case you get wrong normalisation