How can I change the y-axis in logarithmic scale in TGraph script

Hi,
I am making a TGraph script for the comparison of two data points. I need this comparison on a logarithmic y-axis for both data points.
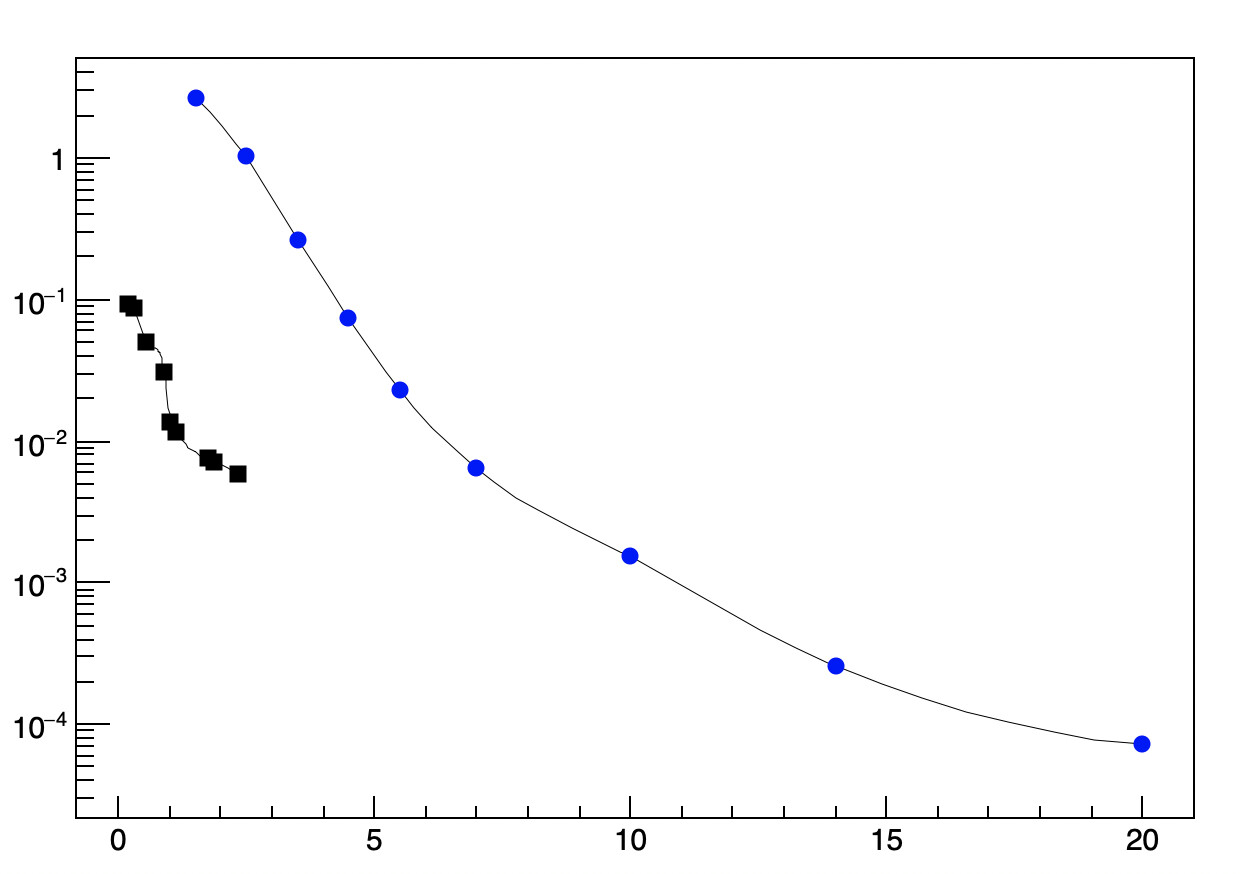
Also, I want to change the data points from ‘star’ style representation to in ‘dot or square’ style representation.
I am attaching the script here.

combined.C (1.1 KB)

For log scale:

  c1->SetLogy(1);

For the markers, you already have the code there (SetMarkerStyle); just don’t use the option “*” when adding the graphs or drawing the multigraph (use “P”). By the way, remove the option “A” when adding the graphs.

  mg->Add(gr1,"CP");
  mg->Add(gr2,"CP");
  mg->Draw("ALP");

Thank you so much its working.

void combined()
{
   TCanvas *c1= new TCanvas("c1","comparison graph of D0 pT spectra",700,500);
   c1->SetLogy();

   const Int_t n = 9;
   Float_t x1[n] = {0.179335, 0.301069, 0.538599, 0.9038, 1.02257, 1.14133, 1.74109, 1.86283, 2.34086};
   Float_t y1[n] = {0.0918845, 0.0876225, 0.0506373, 0.030292, 0.0137459, 0.0115158, 0.00747785, 0.00719284, 0.00577122};
   Float_t x2[n] = {1.5, 2.5, 3.5, 4.5, 5.5, 7,10, 14, 20};
   Float_t y2[n] = {2.65, 1.03, 0.262, 0.0744, 0.0226, 0.00646, 0.00152, 0.000258, 0.0000716};

   auto gr1 = new TGraph(n,x1,y1);
   auto gr2 = new TGraph(n,x2,y2);
   gr1->SetMarkerColor(kBlack);
   gr1->SetMarkerStyle(kFullSquare);
   gr2->SetMarkerColor(kBlue);
   gr2->SetMarkerStyle(kFullCircle);

   auto mg = new TMultiGraph();
   mg->Add(gr1,"CP");
   mg->Add(gr2,"CP");
   mg->Draw("A");
}

This topic was automatically closed 14 days after the last reply. New replies are no longer allowed.