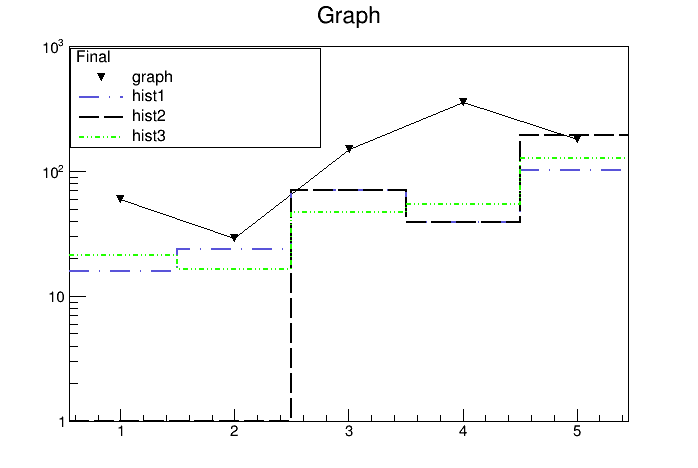
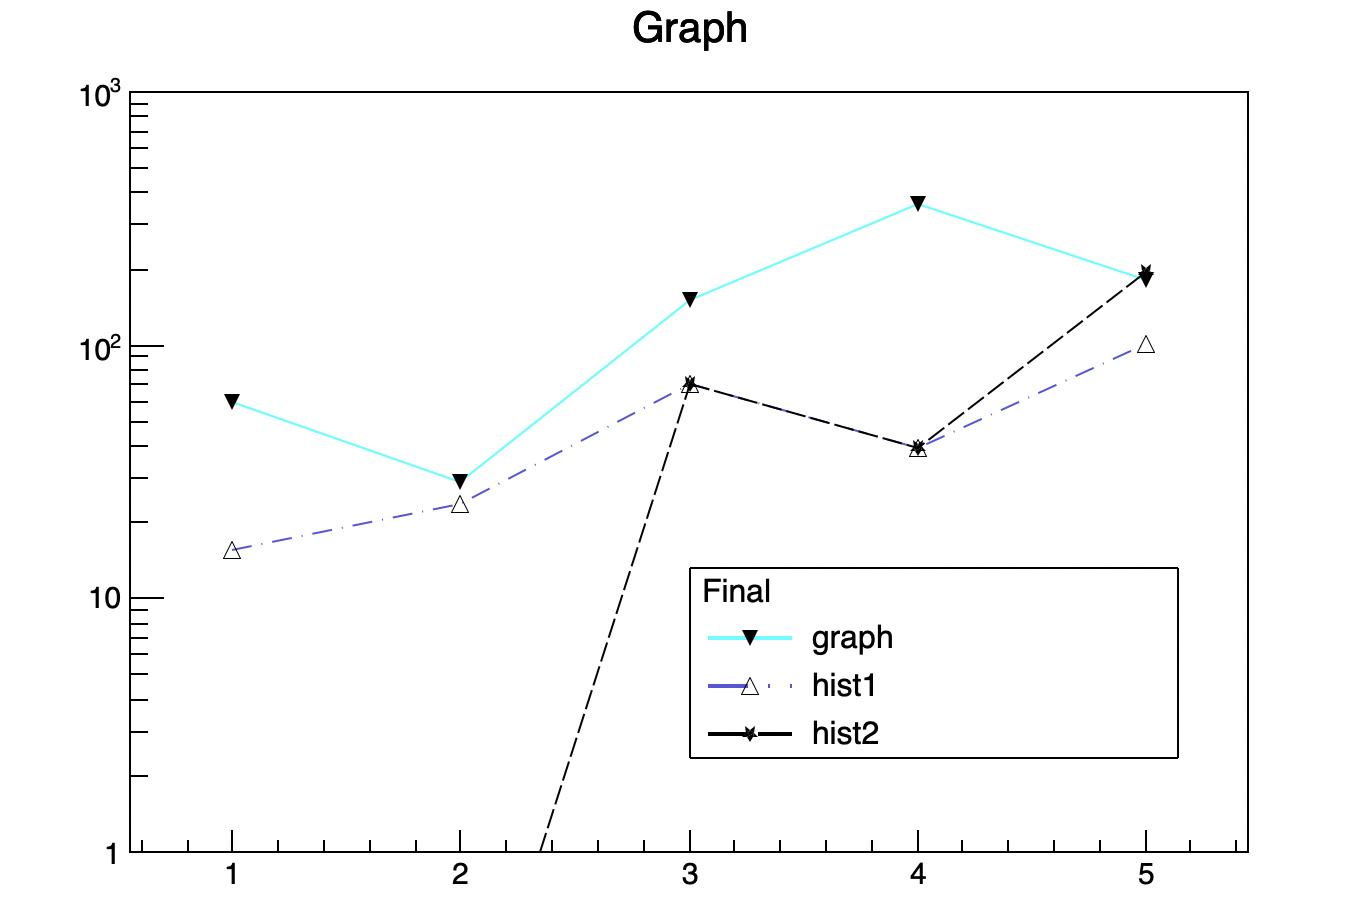
I have 3 histogram and 1 graph file. I want to draw the line between the histogram bins directly as it is drawn in case of graph. How can I modify the following code.rootf.zip (58.0 KB) .
{
  TFile *f1 = TFile::Open("N.root");
   TCanvas *c = (TCanvas *)f1->Get("c1");
   TGraphErrors *g1 = (TGraphErrors *)c->GetListOfPrimitives()->FindObject("Graph");
   c->Close();
  g1->GetXaxis()->SetRangeUser(0,6);
 g1->GetYaxis()->SetRangeUser(1,1000);

   g1->SetMarkerStyle(23);
   g1->Draw("L");
   g1->GetXaxis()->SetNdivisions(509);
   gPad->SetLogy();


   TFile *f2 = TFile::Open("hist1.root");
   TH1D* h1 = (TH1D*)f2->Get("h16");
   h1->Draw("hist same");
   h1->SetLineStyle(10);
   h1->SetMarkerStyle(26);
   h1->SetLineColor(9);
   h1->SetLineWidth(2);

   TFile *f3 = TFile::Open("hist2.root");
   TH1D* h2 = (TH1D*)f3->Get("h16");
   h2->Draw("hist same");
   h2->SetName("b");
   h2->SetLineStyle(9);
   h2->SetMarkerStyle(29);
   h2->SetLineColor(1);
   h2->SetLineWidth(2);

   TFile *f4 = TFile::Open("hist3.root");
   TH1D* h3 = (TH1D*)f4->Get("h16");
   h3->Draw("hist same");
   h3->SetName("b");
   h3->SetLineStyle(8);
   h3->SetMarkerStyle(24);
   h3->SetLineColor(80);
   h3->SetLineWidth(2);

   auto leg = new TLegend(0.51,0.69,0.9,0.9);
   leg->SetHeader("Final");
   leg->AddEntry(g1,"graph","p");
   leg->AddEntry(h1, "hist1","l");
   leg->AddEntry(h2, "hist2","l");
   leg->AddEntry(h3,"hist3","l");

   leg->SetFillColor(10);
   leg->Draw();
}
Thanks. Looking forward for the answer.
ROOT Version: 16.04Platform: Ubuntu 20.04Compiler: Not Provided
Try including theoption “L” when drawing them.
Thanks for the reply but this does not work. I have tried all the options and the above-shown fig is the best what I got. Draw panel helps to get a marker at the peak of each bar but the issue of connecting line remains the same.
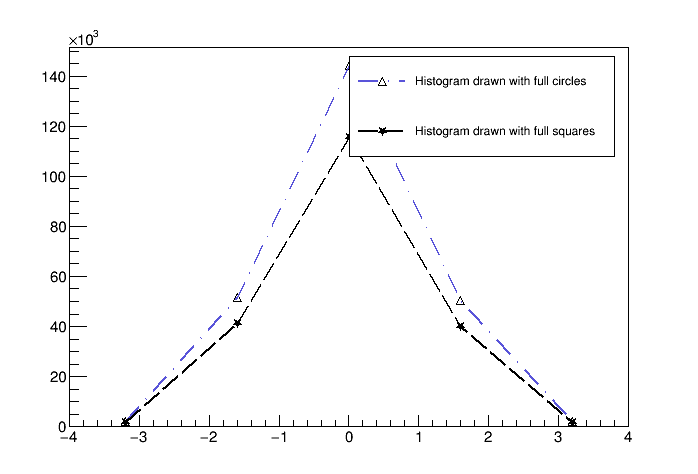
This
void aa()
{
   auto C = new TCanvas();

   gStyle->SetOptTitle(kFALSE);
   gStyle->SetOptStat(0);

   auto h1 = new TH1F ("h1","Histogram drawn with full circles",5,-4,4);
   auto h2 = new TH1F ("h2","Histogram drawn with full squares",5,-4,4);

   TRandom3 rng;
   Double_t px,py;
   for (Int_t i = 0; i < 25000; i++) {
      rng.Rannor(px,py);
      h1->Fill(px,10.);
      h2->Fill(px, 8.);
   }
   h1->SetMarkerStyle(kFullCircle);
   h2->SetMarkerStyle(kFullSquare);

h1->SetLineStyle(10);
h1->SetMarkerStyle(26);
h1->SetLineColor(9);
h1->SetLineWidth(2);
h2->SetLineStyle(9);
h2->SetMarkerStyle(29);
h2->SetLineColor(1);
h2->SetLineWidth(2);

   h1->Draw("HIST L P");
   h2->Draw("HIST L P SAME");

   gPad->BuildLegend();
}
gives
Thanks, it works but with new problems. The TGraph and TLegend got disappear.
{
   TFile *f1 = TFile::Open("N.root");
   TCanvas *c = (TCanvas *)f1->Get("c1");
   TGraphErrors *g1 = (TGraphErrors *)c->GetListOfPrimitives()->FindObject("Graph");
   c->Close();
  g1->GetXaxis()->SetRangeUser(0,6);
 g1->GetYaxis()->SetRangeUser(1,1000);

   g1->SetMarkerStyle(23);
   //g1->Draw("AP");
   g1->SetLineColor(7);
   g1->SetLineWidth(2);
   g1->Draw("AP");
   g1->GetXaxis()->SetNdivisions(509);
   gPad->SetLogy();

   TFile *f2 = TFile::Open("hist1.root");
   TH1D* h1 = (TH1D*)f2->Get("h16");
   h1->Draw("hist same");
   h1->SetMarkerStyle(kFullCircle);
   h1->SetLineStyle(10);
h1->SetMarkerStyle(26);
h1->SetLineColor(9);
h1->SetLineWidth(2);
h1->Draw("HIST L P");

   TFile *f3 = TFile::Open("hist2.root");
   TH1D* h2 = (TH1D*)f3->Get("h16");
   h2->SetMarkerStyle(kFullSquare);
   h2->SetLineStyle(9);
h2->SetMarkerStyle(29);
h2->SetLineColor(1);
h2->SetLineWidth(2);
h2->Draw("HIST L P SAME");


      auto leg = new TLegend(0.51,0.69,0.9,0.9);
   leg->SetHeader("Final");
   leg->AddEntry(g1,"graph","");
      leg->AddEntry(h1, "hist1","l");
      leg->AddEntry(h1, "hist1","l");
}
couet
October 7, 2020, 8:19am
7
We are missing the ROOT files to be ables to run your macro.
couet
October 7, 2020, 8:21am
8
You are missing a SAME here:
h1->Draw("HIST L P");
This command will start a new plot.
couet
October 7, 2020, 8:25am
9
{
   TFile *f1 = TFile::Open("N.root");
   TCanvas *c = (TCanvas *)f1->Get("c1");
   TGraphErrors *g1 = (TGraphErrors *)c->GetListOfPrimitives()->FindObject("Graph");
   c->Close();
   g1->GetXaxis()->SetRangeUser(0,6);
   g1->GetYaxis()->SetRangeUser(1,1000);

   g1->SetMarkerStyle(23);
   g1->SetLineColor(7);
   g1->SetLineWidth(2);
   g1->Draw("AP");
   g1->GetXaxis()->SetNdivisions(509);
   gPad->SetLogy();

   TFile *f2 = TFile::Open("hist1.root");
   TH1D* h1 = (TH1D*)f2->Get("h16");
   h1->SetMarkerStyle(kFullCircle);
   h1->SetLineStyle(10);
   h1->SetMarkerStyle(26);
   h1->SetLineColor(9);
   h1->SetLineWidth(2);
   h1->Draw("HIST L P SAME");

   TFile *f3 = TFile::Open("hist2.root");
   TH1D* h2 = (TH1D*)f3->Get("h16");
   h2->SetMarkerStyle(kFullSquare);
   h2->SetLineStyle(9);
   h2->SetMarkerStyle(29);
   h2->SetLineColor(1);
   h2->SetLineWidth(2);
   h2->Draw("HIST L P SAME");

   auto leg = new TLegend(0.51,0.69,0.9,0.9);
   leg->SetHeader("Final");
   leg->AddEntry(g1,"graph","");
   leg->AddEntry(h1, "hist1","l");
   leg->AddEntry(h2, "hist2","l");
}
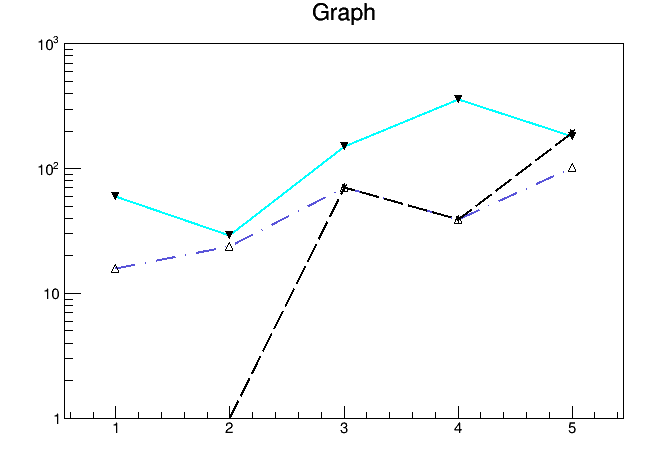
Thanks, it worked. Just TLegend missing.hist1.root (43.6 KB) hist2.root (44.0 KB) N.root (8.2 KB)
couet
October 7, 2020, 11:18am
11
of course you should draw the legend at the end:
leg->Draw();
couet
October 7, 2020, 11:23am
12
{
   TFile *f1 = TFile::Open("N.root");
   TCanvas *c = (TCanvas *)f1->Get("c1");
   TGraphErrors *g1 = (TGraphErrors *)c->GetListOfPrimitives()->FindObject("Graph");
   c->Close();
   g1->GetXaxis()->SetRangeUser(0,6);
   g1->GetYaxis()->SetRangeUser(1,1000);

   g1->SetMarkerStyle(23);
   g1->SetLineColor(7);
   g1->SetLineWidth(2);
   g1->Draw("APL");
   g1->GetXaxis()->SetNdivisions(509);
   gPad->SetLogy();

   TFile *f2 = TFile::Open("hist1.root");
   TH1D* h1 = (TH1D*)f2->Get("h16");
   h1->SetMarkerStyle(kFullCircle);
   h1->SetLineStyle(10);
   h1->SetMarkerStyle(26);
   h1->SetLineColor(9);
   h1->SetLineWidth(2);
   h1->Draw("HIST L P SAME");

   TFile *f3 = TFile::Open("hist2.root");
   TH1D* h2 = (TH1D*)f3->Get("h16");
   h2->SetMarkerStyle(kFullSquare);
   h2->SetLineStyle(9);
   h2->SetMarkerStyle(29);
   h2->SetLineColor(1);
   h2->SetLineWidth(2);
   h2->Draw("HIST L P SAME");

   auto leg = new TLegend(0.5,0.2,0.85,0.4);
   leg->SetHeader("Final");
   leg->AddEntry(g1,"graph","PL");
   leg->AddEntry(h1, "hist1","PL");
   leg->AddEntry(h2, "hist2","PL");
   leg->Draw();
}
Thank you to point out my silly mistake.
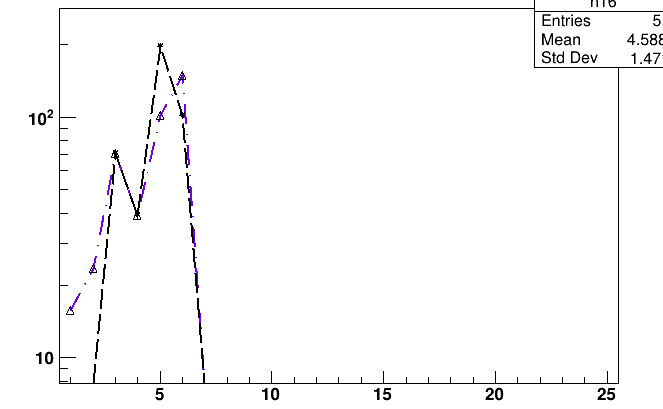
Hello,1.root (14.6 KB) 2.root (44.2 KB) m1.C (850 Bytes) ) i got this result.
If I open this in TBrowser it shows the 2.root file has value at x=1 but here it’s not included.
2nd- I created c1.root file from c1.C file which has only one value(at x=5). When I draw this with hist. 2 or3.root, it create results for x=5-6 range only. How it should be modified for getting the x=1-5 range. c1.C (211 Bytes) c1.root (14.5 KB) m1.C (852 Bytes)
I tried to define the range for h1 but it does not work.
couet
October 12, 2020, 1:51pm
15
I do not understand what you mean… 2.root contains 21 TH1D
You file c1.root does not correspond to c1.C. When I recreate c1.root for c1.C I get the same plot.
1st problem - 2.root(check h16 histogram) has some value for x=1 but the line starts from x=2(which has bin value zero) in the canvas and x=1 point values are not present in this.
couet
October 12, 2020, 2:53pm
17
I do not see any problem with h16. Can you tell me which Drawing comment you are using ?
1st - If you draw 2.root (h16 histogram)(44.2 KB) and 1.root (14.6 KB) root files using m1.C (850 Bytes) then we will get this result
The highlighted point should be connected with other points of the same line(blue line) but line itself starts from point 2.
couet
October 13, 2020, 8:19am
19
   TFile *f1 = TFile::Open("1.root");
   TCanvas *c = (TCanvas *)f1->Get("c1");
   TGraphErrors *g1 = (TGraphErrors *)c->GetListOfPrimitives()->FindObject("Graph");
   c->Close();
   g1->GetXaxis()->SetRangeUser(0,6);
   g1->GetYaxis()->SetRangeUser(-1,200);

   g1->SetMarkerStyle(22);
   g1->SetLineColor(2);
   g1->SetLineWidth(3);
   g1->SetLineStyle(9);
   g1->Draw("");
   g1->GetXaxis()->SetNdivisions(509);

   TFile *f2 = TFile::Open("2.root");
   TH1D* h1 = (TH1D*)f2->Get("h16");
   h1->SetLineStyle(9);
   h1->SetMarkerStyle(21);
   h1->SetLineColor(9);
   h1->SetLineWidth(3);
   h1->Draw("HIST L P SAME");

   auto leg = new TLegend(0.6,0.69,0.9,0.9);
   leg->SetHeader("R");
   leg->AddEntry(g1,"1","l p");
   leg->AddEntry(h1, "2","a p l");
   leg->Draw();
}
Thanks @couet .c1.root (14.5 KB) has single value(x=5) and 2.root(h16)2.root (44.2 KB) has x=1-5 values. How can I do it using this m1.C (852 Bytes) ? I tried to modify h1 range but didn’t work.
couet
October 14, 2020, 9:03am
21
you sent 1.root and 2.root but your macro access c1.root and 3.root