c1.root c1.root (14.5 KB) this has only one value.
2.root (44.2 KB) and 3.root (43.9 KB) (h16) both have same axis range and used here as dummy. So if you want to try then you can use any of them in macro file.
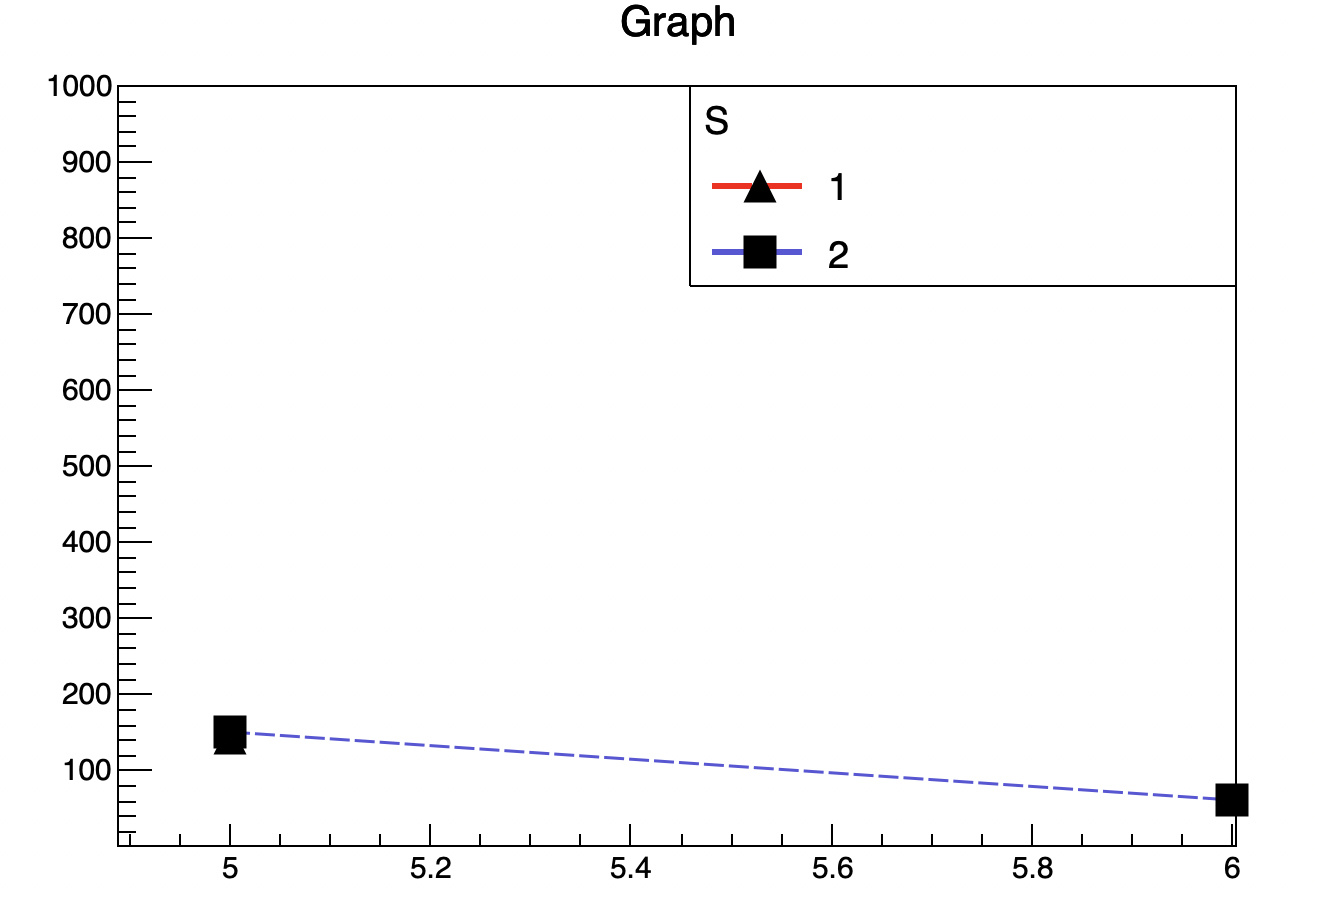
Nothing is wrong with this but I want to get x-axis range x=1-5 which is x=5-6 right now.
In my macro range is defined but as c1.root has an only single value corresponding to x=5 so its drawing only for x=5-6.
g1->GetXaxis()->SetRangeUser(0,6);
{
TFile *f1 = TFile::Open("c1.root");
TCanvas *c = (TCanvas *)f1->Get("c1");
TGraphErrors *g1 = (TGraphErrors *)c->GetListOfPrimitives()->FindObject("Graph");
c->Close();
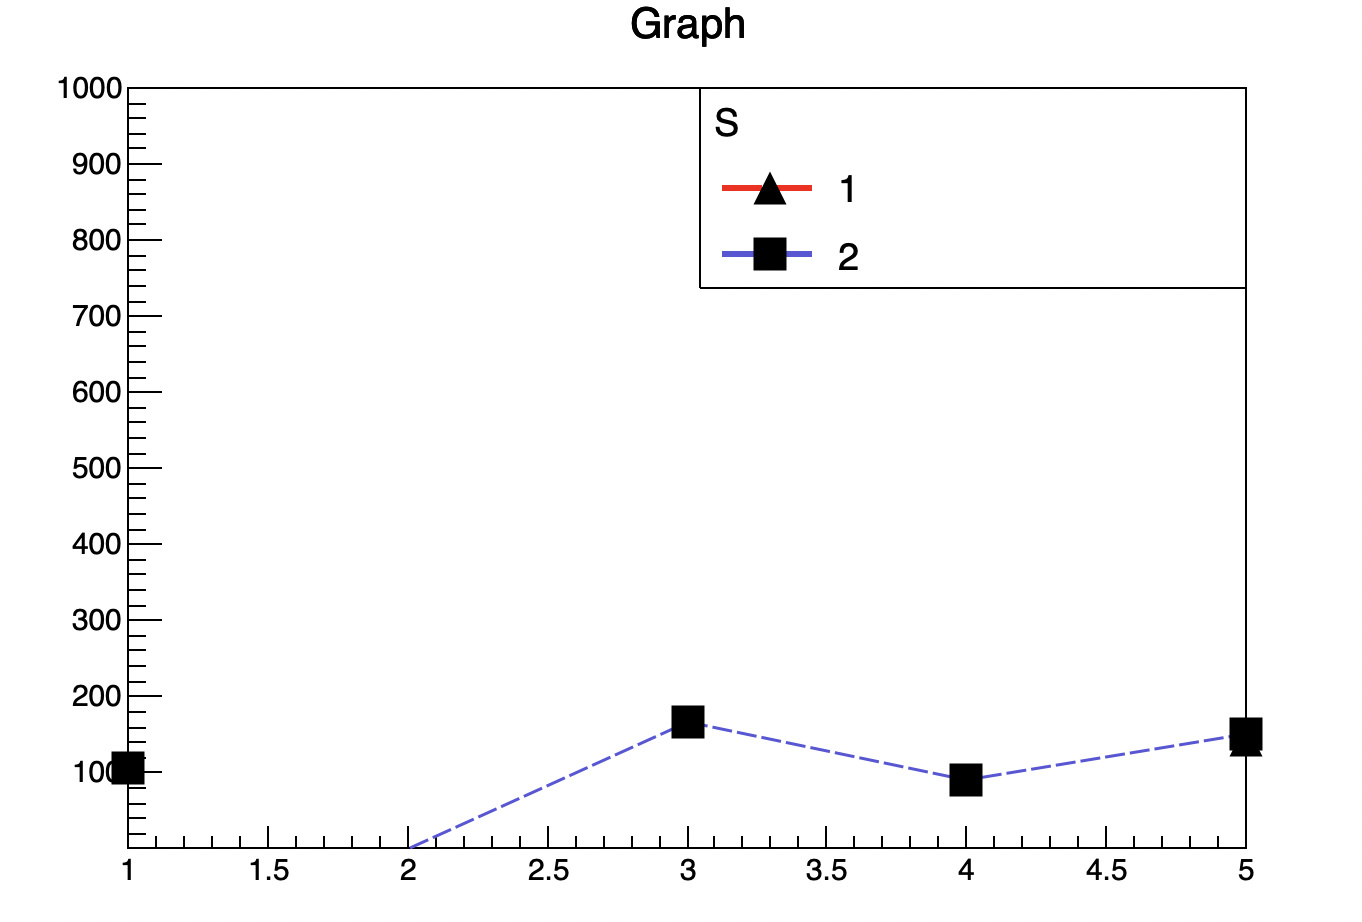
g1->GetXaxis()->SetLimits(1,5);
g1->GetYaxis()->SetRangeUser(1,1000);
g1->SetMarkerStyle(22);
g1->SetMarkerSize(2);
g1->SetLineColor(2);
g1->SetLineWidth(3);
g1->SetLineStyle(9);
g1->Draw("");
g1->GetXaxis()->SetNdivisions(509);
TFile *f2 = TFile::Open("3.root");
TH1D* h1 = (TH1D*)f2->Get("h16");
h1->SetLineStyle(9);
h1->SetMarkerStyle(21);
h1->SetMarkerSize(2);
h1->SetLineColor(9);
h1->SetLineWidth(3);
h1->Draw("HIST L P SAME");
auto leg = new TLegend(0.51,0.69,0.9,0.9);
leg->SetHeader("S");
leg->AddEntry(g1,"1","l p");
leg->AddEntry(h1, "2","a p l");
leg->Draw();
}
Thank you so much !! @couet 