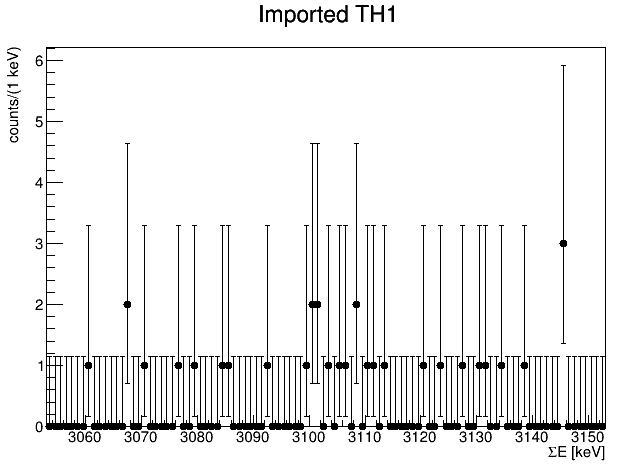
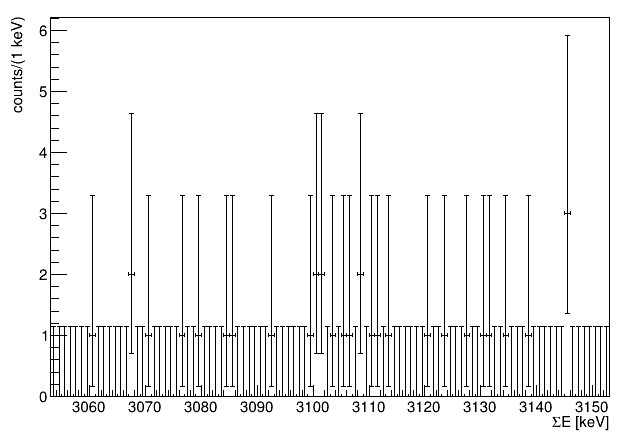
I am importing histogram from root file and while plotting the histogram, I am having these additional events at 0, as shown in the following figure which shouldn’t be here.
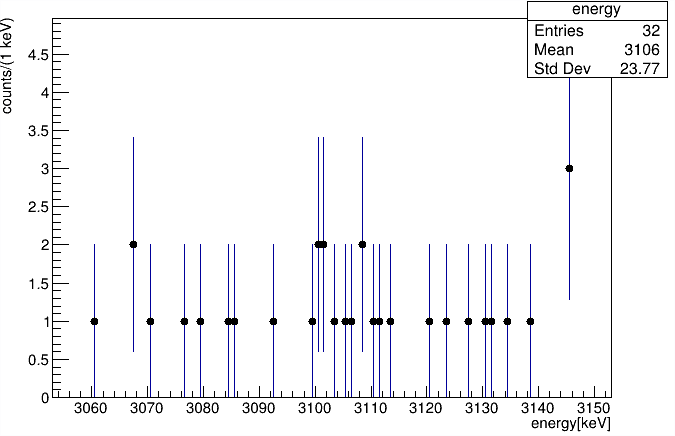
Original histogram in root file is like this i.e. it contains only 32 events. None of the event occurs at zero.
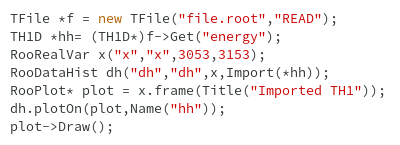
Could anyone tell me why is this happening? Piece of code i’m using is:
But for the histograms having large number of events, the same code is working fine.
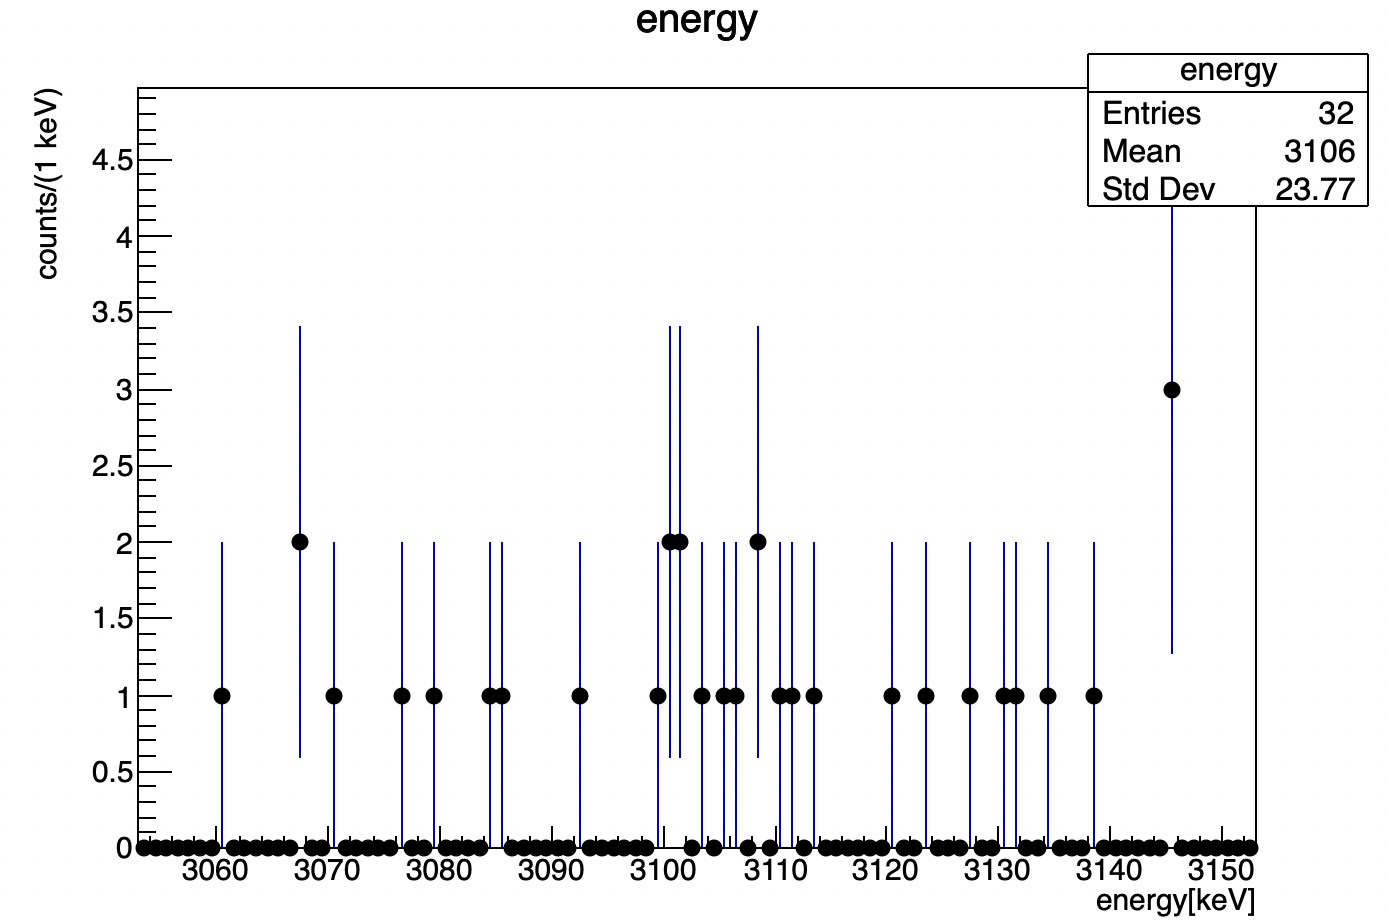
Which is a bit different from what you get as there is no error bars won the Point at ). So RooPlot seems to do something else. @moneta ta is the expert in that area.
RooPlot by default plots the Poisson error. You can have this behaviour for an histogram, by calling TH1::SetBinErrorOption(TH1::kPoisson).
This will give you an error bar for bins with zero entries.
There will be a remaining difference. For ROOT the error at bin 0 is ~ 1.8, while in RooFit is ~ 1.2. This is because RooFit uses for that case the 1-side 68% interval while ROOT the 2-side interval. It is a question of definition, but my preference is for keeping the same procedure (2-side intervals) independent of the number of observed events.