Pad have the same size but the frames inside the pads have different sizes as you change the margin of the first one. There is a macro doing what you are looking for. I adapted to your case. It computes the frame to make sure le plots have all the same despite despite the fact the first and last pads have different sizes fro the other pads.
void CanvasPartition(TCanvas *C,const Int_t Nx = 2,const Int_t Ny = 2,
Float_t lMargin = 0.15, Float_t rMargin = 0.05,
Float_t bMargin = 0.15, Float_t tMargin = 0.05);
void test2()
{
gStyle->SetOptStat(0);
TCanvas *C = (TCanvas*) gROOT->FindObject("C");
if (C) delete C;
C = new TCanvas("C","canvas",1024,640);
C->SetFillStyle(4000);
// Number of PADS
const Int_t Nx = 4;
const Int_t Ny = 1;
// Margins
Float_t lMargin = 0.12;
Float_t rMargin = 0.05;
Float_t bMargin = 0.15;
Float_t tMargin = 0.03;
// Canvas setup
CanvasPartition(C,Nx,Ny,lMargin,rMargin,bMargin,tMargin);
TPad *pad[Nx][Ny];
for (Int_t i=0;i<Nx;i++) {
for (Int_t j=0;j<Ny;j++) {
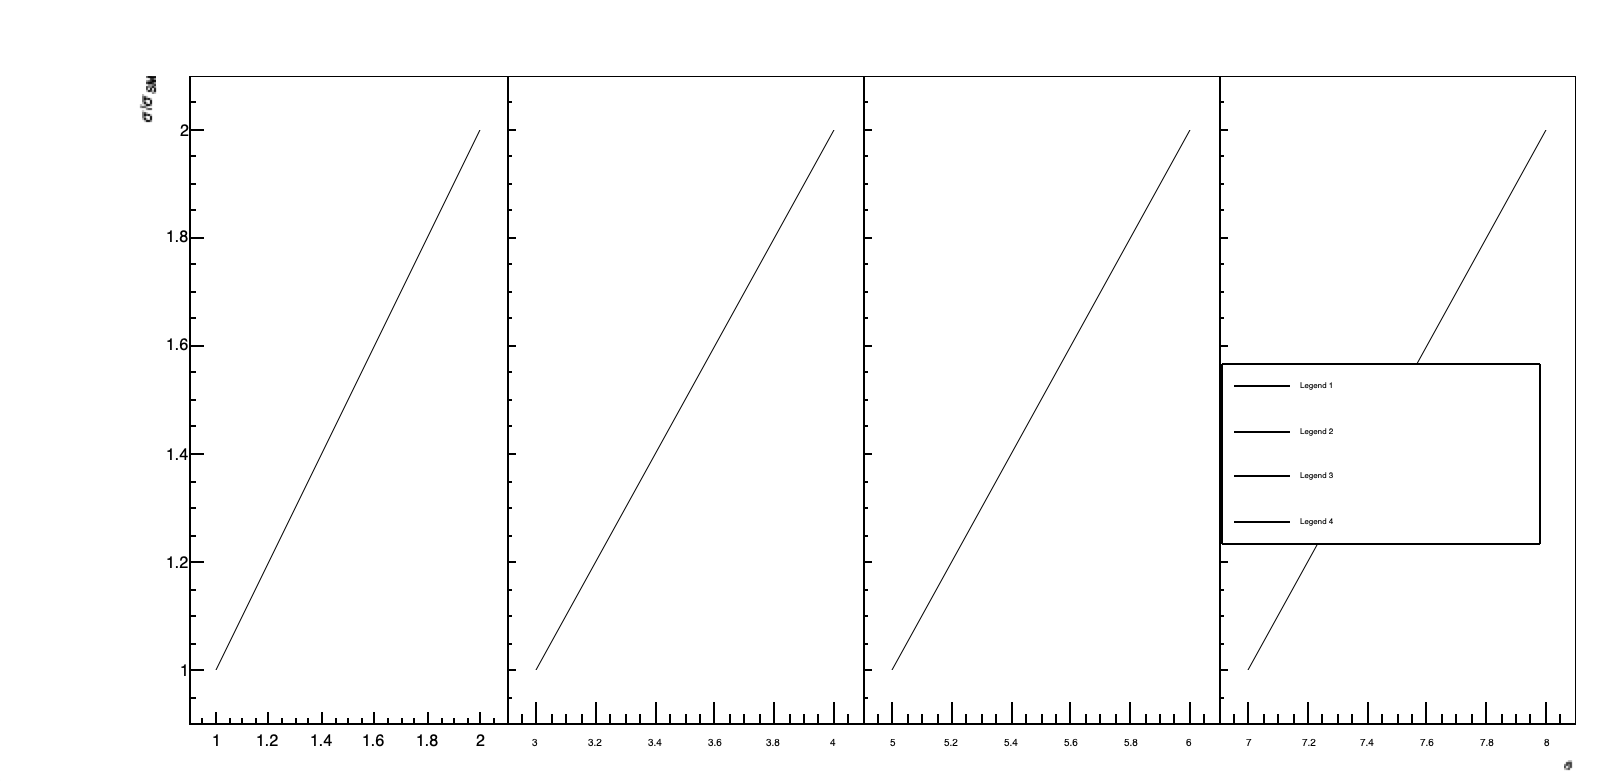
auto gr = new TGraph();
gr->AddPoint(1,1);
gr->SetMinimum(0.6);
gr->SetMaximum(2);
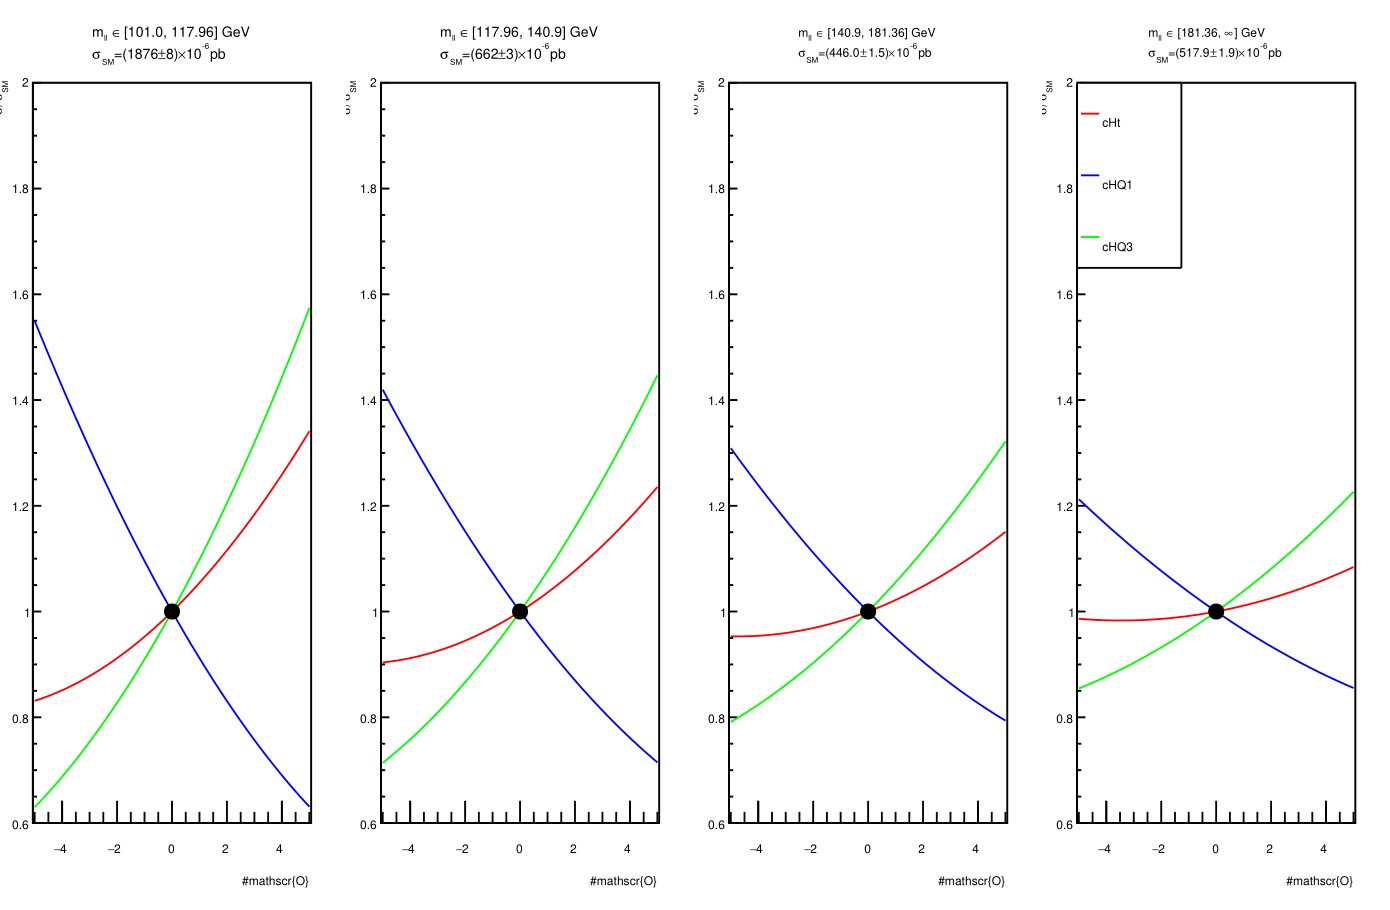
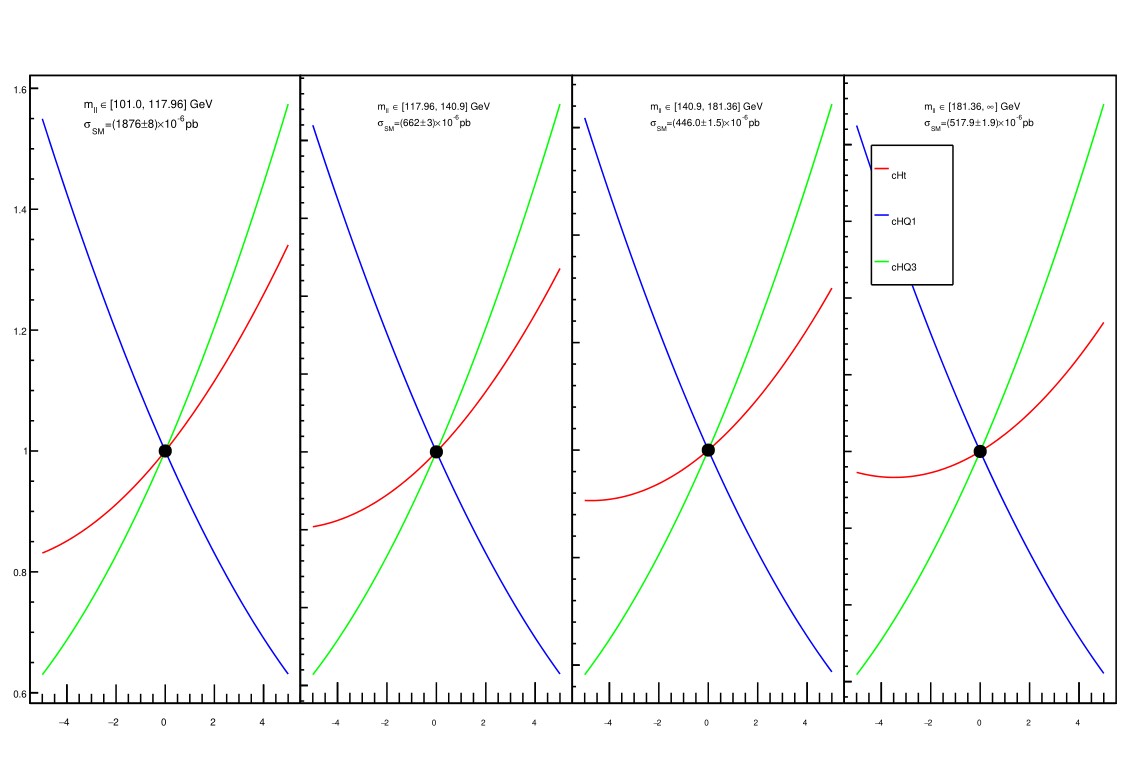
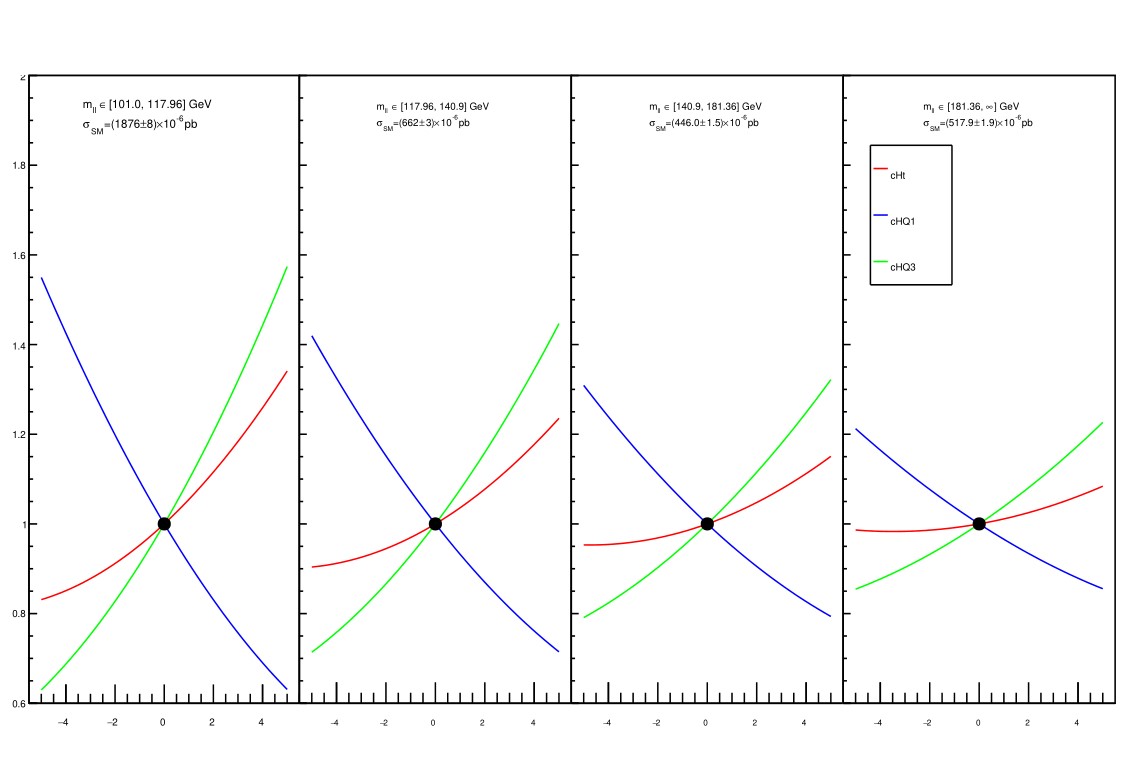
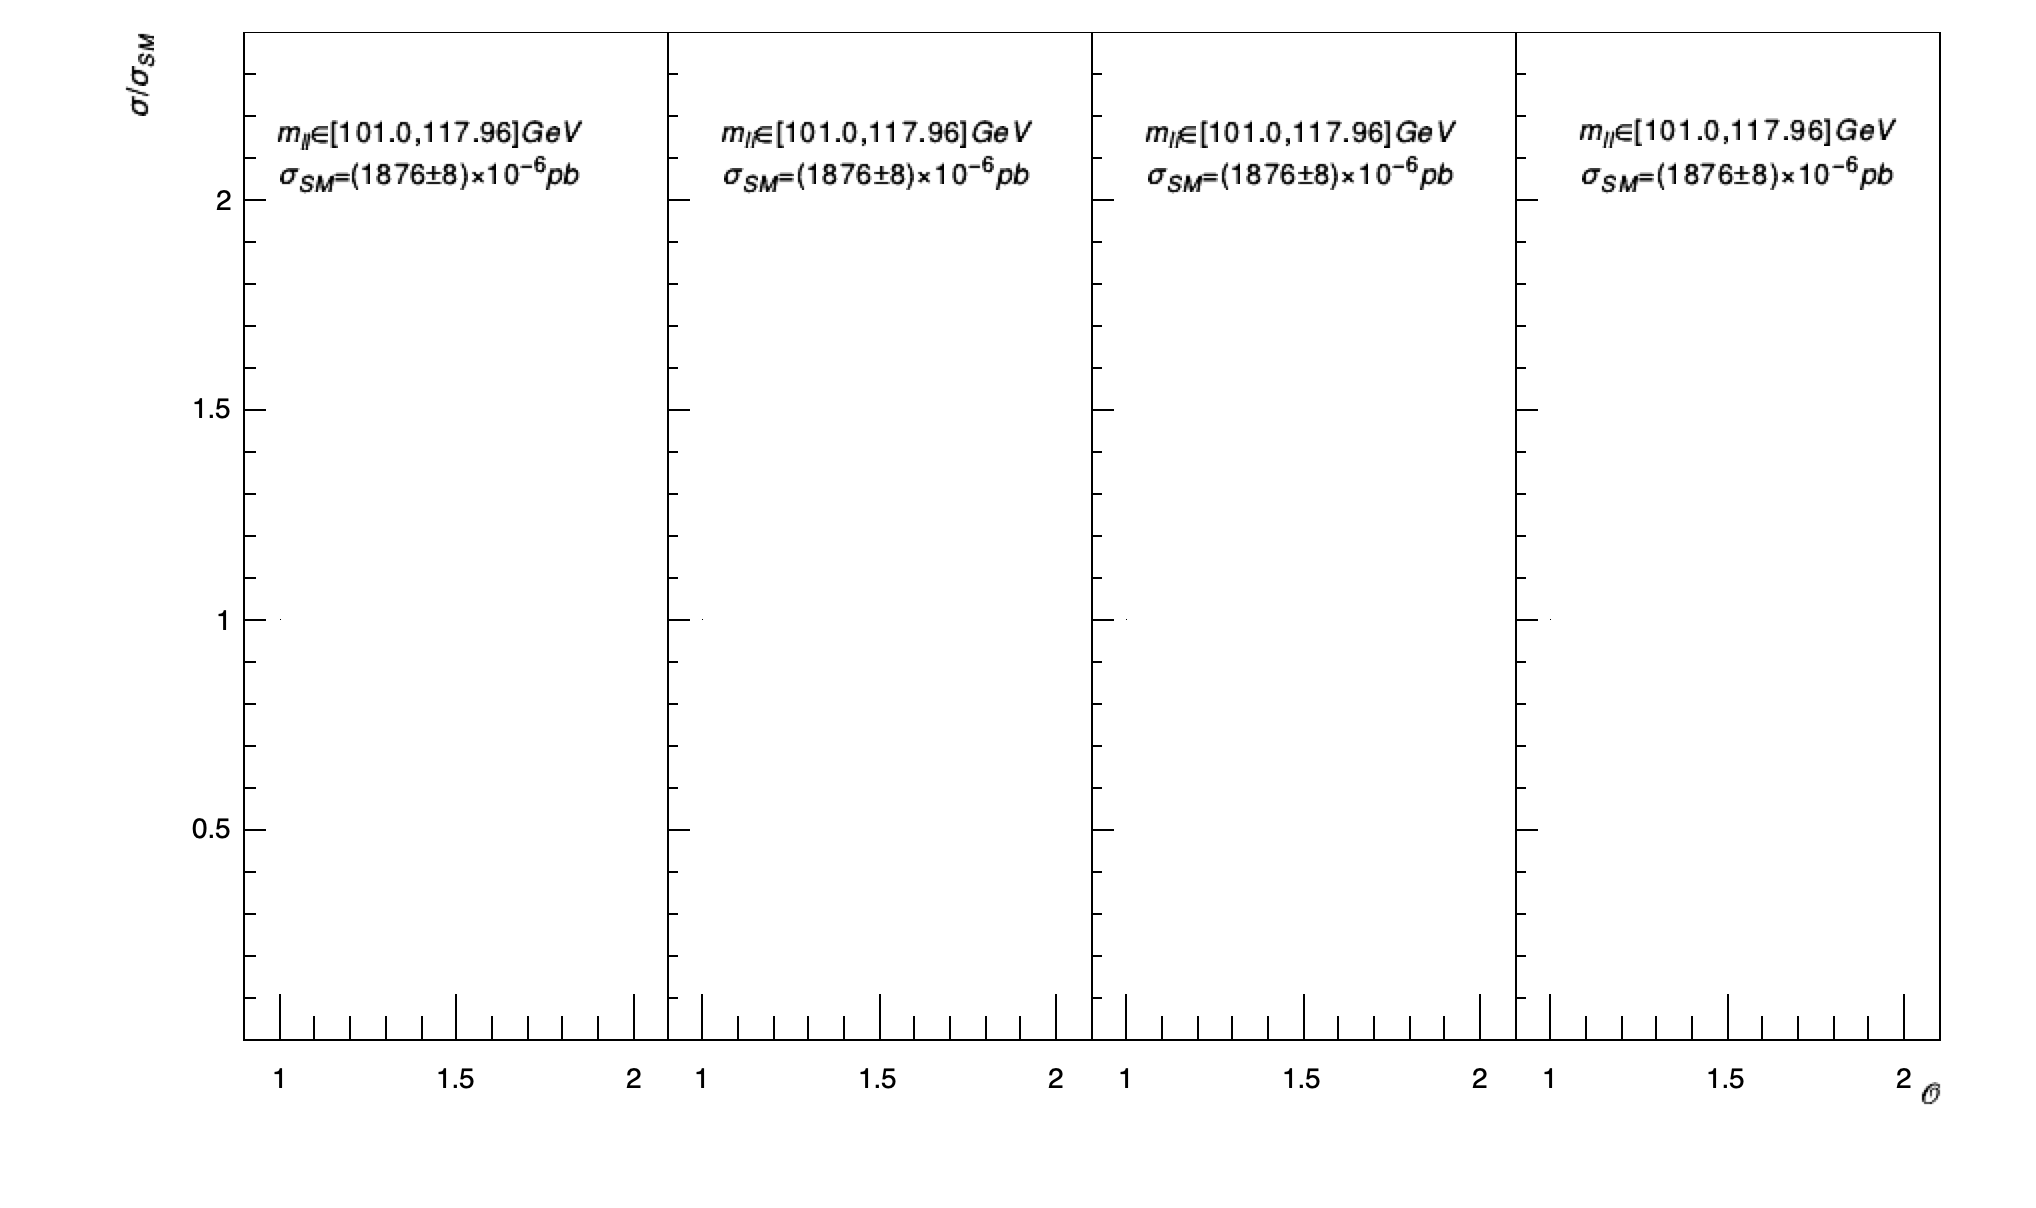
gr->SetTitle("\\splitline{m_{ll} \\in [101.0, 117.96] GeV}{\\sigma_{SM}=(1876\\pm8)\\times10^{-6}pb}");
if (i == 0) gr->GetYaxis()->SetTitle("\\sigma/\\sigma_{SM}");
if (i == 3) gr->GetXaxis()->SetTitle("\\mathscr{O}");
C->cd(0);
// Get the pads previously created.
char pname[16];
sprintf(pname,"pad_%i_%i",i,j);
pad[i][j] = (TPad*) gROOT->FindObject(pname);
pad[i][j]->Draw();
pad[i][j]->cd();
// Size factors
Float_t xFactor = pad[0][0]->GetAbsWNDC()/pad[i][j]->GetAbsWNDC();
Float_t yFactor = pad[0][0]->GetAbsHNDC()/pad[i][j]->GetAbsHNDC();
char hname[16];
sprintf(hname,"h_%i_%i",i,j);
TH1F *hFrame = (TH1F*) gr->GetHistogram()->Clone(hname);
hFrame->Reset();
hFrame->Draw();
// y axis range
hFrame->GetYaxis()->SetRangeUser(0.0001,1.2*gr->GetHistogram()->GetMaximum());
// Format for y axis
hFrame->GetYaxis()->SetLabelFont(43);
hFrame->GetYaxis()->SetLabelSize(16);
hFrame->GetYaxis()->SetLabelOffset(0.02);
hFrame->GetYaxis()->SetTitleFont(43);
hFrame->GetYaxis()->SetTitleSize(16);
hFrame->GetYaxis()->SetTitleOffset(2);
hFrame->GetYaxis()->SetNdivisions(505);
// TICKS Y Axis
hFrame->GetYaxis()->SetTickLength(xFactor*0.04/yFactor);
// Format for x axis
hFrame->GetXaxis()->SetLabelFont(43);
hFrame->GetXaxis()->SetLabelSize(16);
hFrame->GetXaxis()->SetLabelOffset(0.02);
hFrame->GetXaxis()->SetTitleFont(43);
hFrame->GetXaxis()->SetTitleSize(16);
hFrame->GetXaxis()->SetTitleOffset(1);
hFrame->GetXaxis()->SetNdivisions(505);
// TICKS X Axis
hFrame->GetXaxis()->SetTickLength(yFactor*0.06/xFactor);
gr->Draw("P");
gPad->Update();
TPaveText* title = (TPaveText*)gPad->FindObject("title");
if (i==0) {
title->SetX1NDC(0.4);
title->SetY1NDC(0.8);
title->SetX2NDC(0.89);
title->SetY2NDC(0.99);
} else if (i==Nx-1) {
title->SetX1NDC(0.1);
title->SetY1NDC(0.8);
title->SetX2NDC(0.75);
title->SetY2NDC(0.99);
} else {
title->SetX1NDC(0.1);
title->SetY1NDC(0.8);
title->SetX2NDC(0.89);
title->SetY2NDC(0.99);
}
}
}
gPad->Modified();
gPad->Update();
C->cd();
}
void CanvasPartition(TCanvas *C,const Int_t Nx,const Int_t Ny,
Float_t lMargin, Float_t rMargin,
Float_t bMargin, Float_t tMargin)
{
if (!C) return;
// Setup Pad layout:
Float_t vSpacing = 0.0;
Float_t vStep = (1.- bMargin - tMargin - (Ny-1) * vSpacing) / Ny;
Float_t hSpacing = 0.0;
Float_t hStep = (1.- lMargin - rMargin - (Nx-1) * hSpacing) / Nx;
Float_t vposd,vposu,vmard,vmaru,vfactor;
Float_t hposl,hposr,hmarl,hmarr,hfactor;
for (Int_t i=0;i<Nx;i++) {
if (i==0) {
hposl = 0.0;
hposr = lMargin + hStep;
hfactor = hposr-hposl;
hmarl = lMargin / hfactor;
hmarr = 0.0;
} else if (i == Nx-1) {
hposl = hposr + hSpacing;
hposr = hposl + hStep + rMargin;
hfactor = hposr-hposl;
hmarl = 0.0;
hmarr = rMargin / (hposr-hposl);
} else {
hposl = hposr + hSpacing;
hposr = hposl + hStep;
hfactor = hposr-hposl;
hmarl = 0.0;
hmarr = 0.0;
}
for (Int_t j=0;j<Ny;j++) {
if (j==0) {
vposd = 0.0;
vposu = bMargin + vStep;
vfactor = vposu-vposd;
vmard = bMargin / vfactor;
vmaru = 0.0;
} else if (j == Ny-1) {
vposd = vposu + vSpacing;
vposu = vposd + vStep + tMargin;
vfactor = vposu-vposd;
vmard = 0.0;
vmaru = tMargin / (vposu-vposd);
} else {
vposd = vposu + vSpacing;
vposu = vposd + vStep;
vfactor = vposu-vposd;
vmard = 0.0;
vmaru = 0.0;
}
C->cd(0);
char name[16];
sprintf(name,"pad_%i_%i",i,j);
TPad *pad = (TPad*) gROOT->FindObject(name);
if (pad) delete pad;
pad = new TPad(name,"",hposl,vposd,hposr,vposu);
pad->SetLeftMargin(hmarl);
pad->SetRightMargin(hmarr);
pad->SetBottomMargin(vmard);
pad->SetTopMargin(vmaru);
pad->SetFrameBorderMode(0);
pad->SetBorderMode(0);
pad->SetBorderSize(0);
pad->Draw();
}
}
}