Hi,
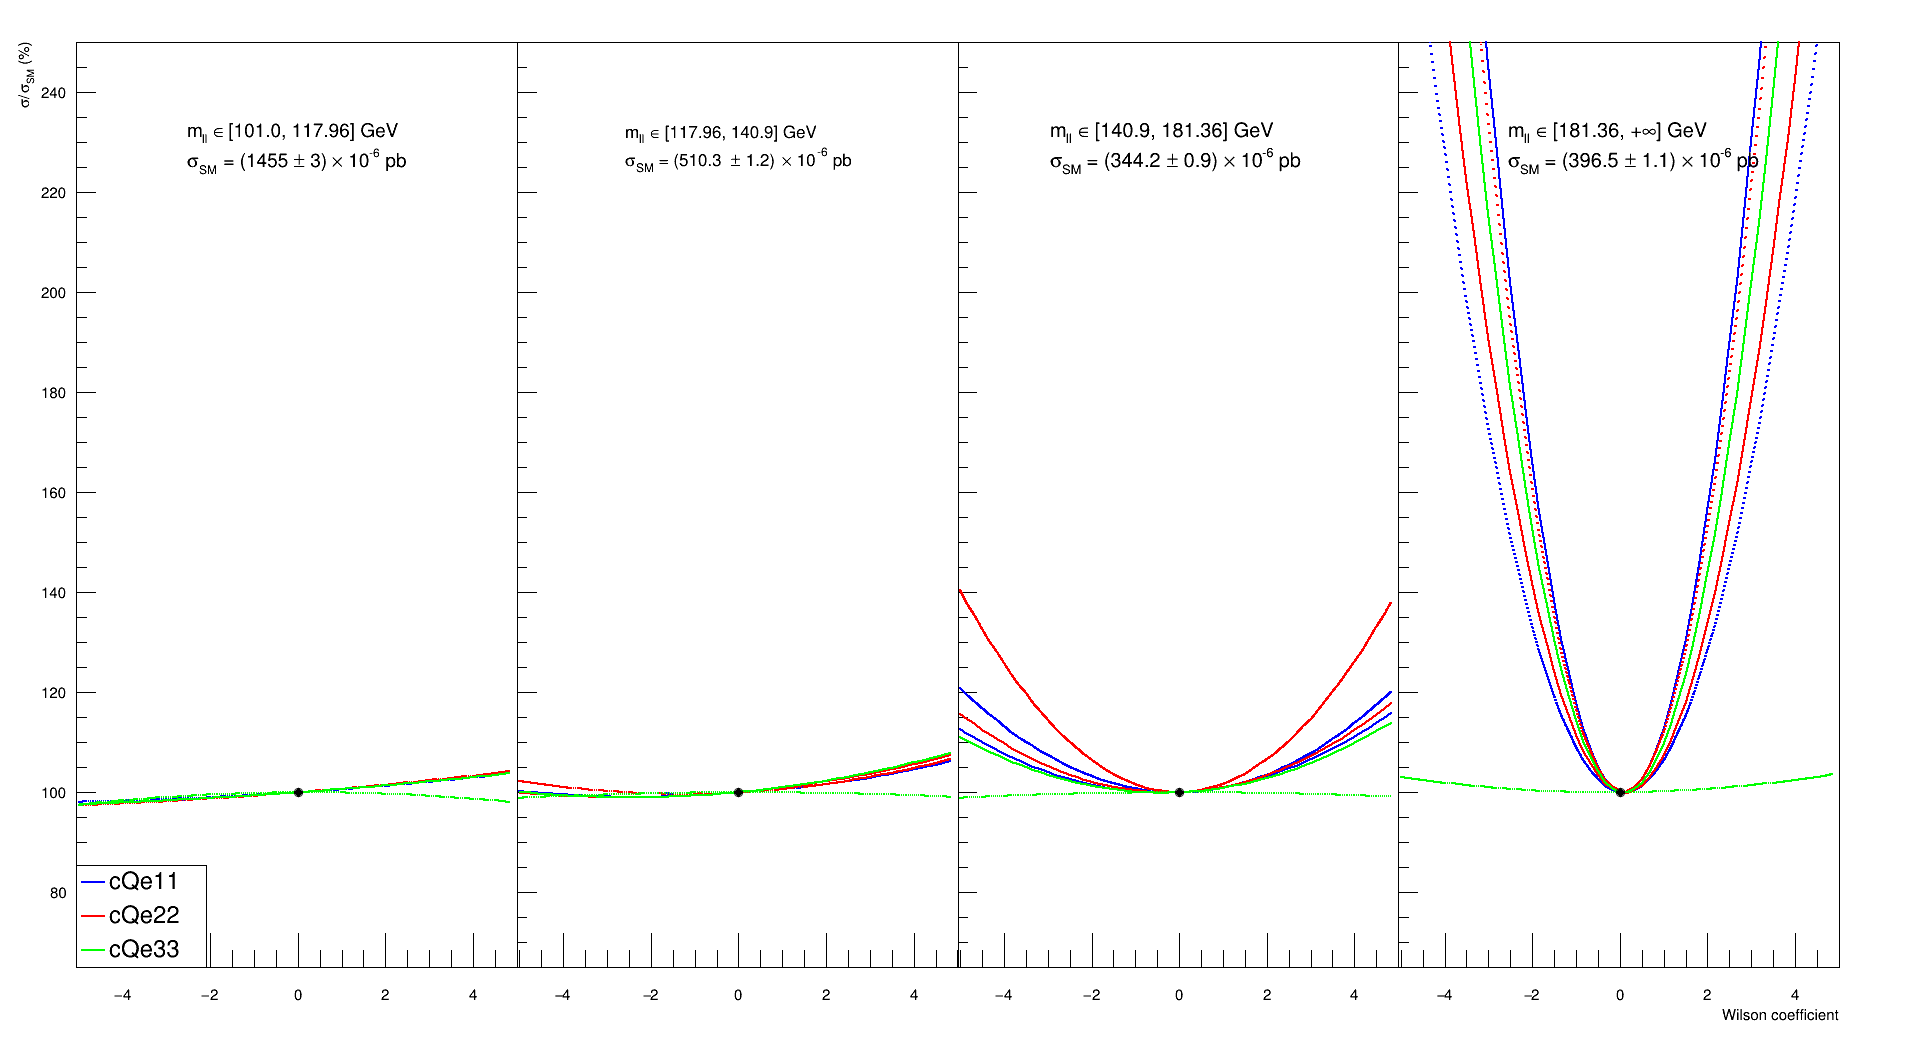
I have two sets of data: one theoretical and another experimental (for example). I want one of them to be a solid line and the other to be a dotted line in a TMultiGraph. Here is the result:
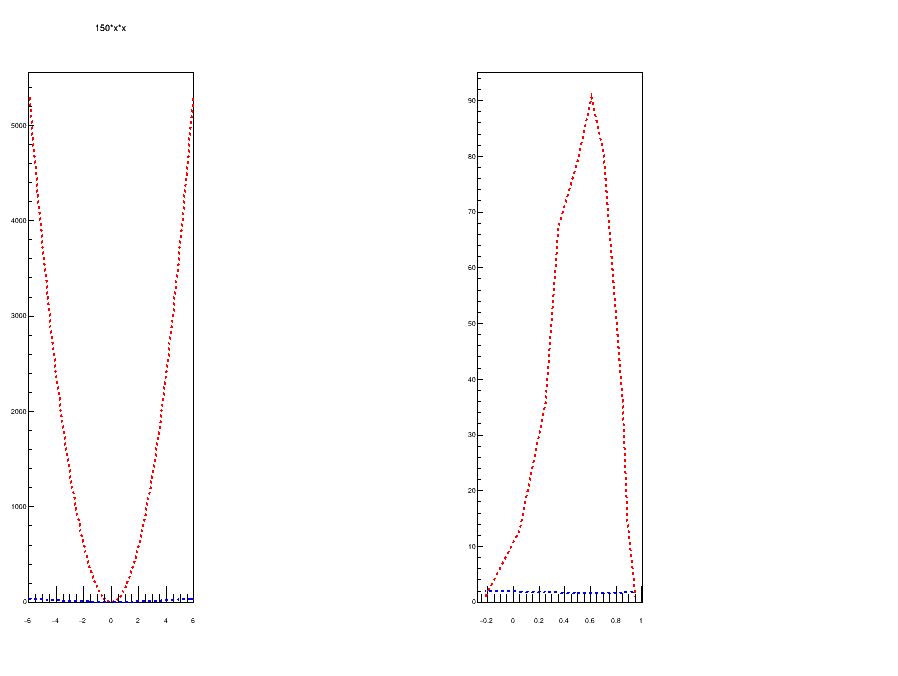
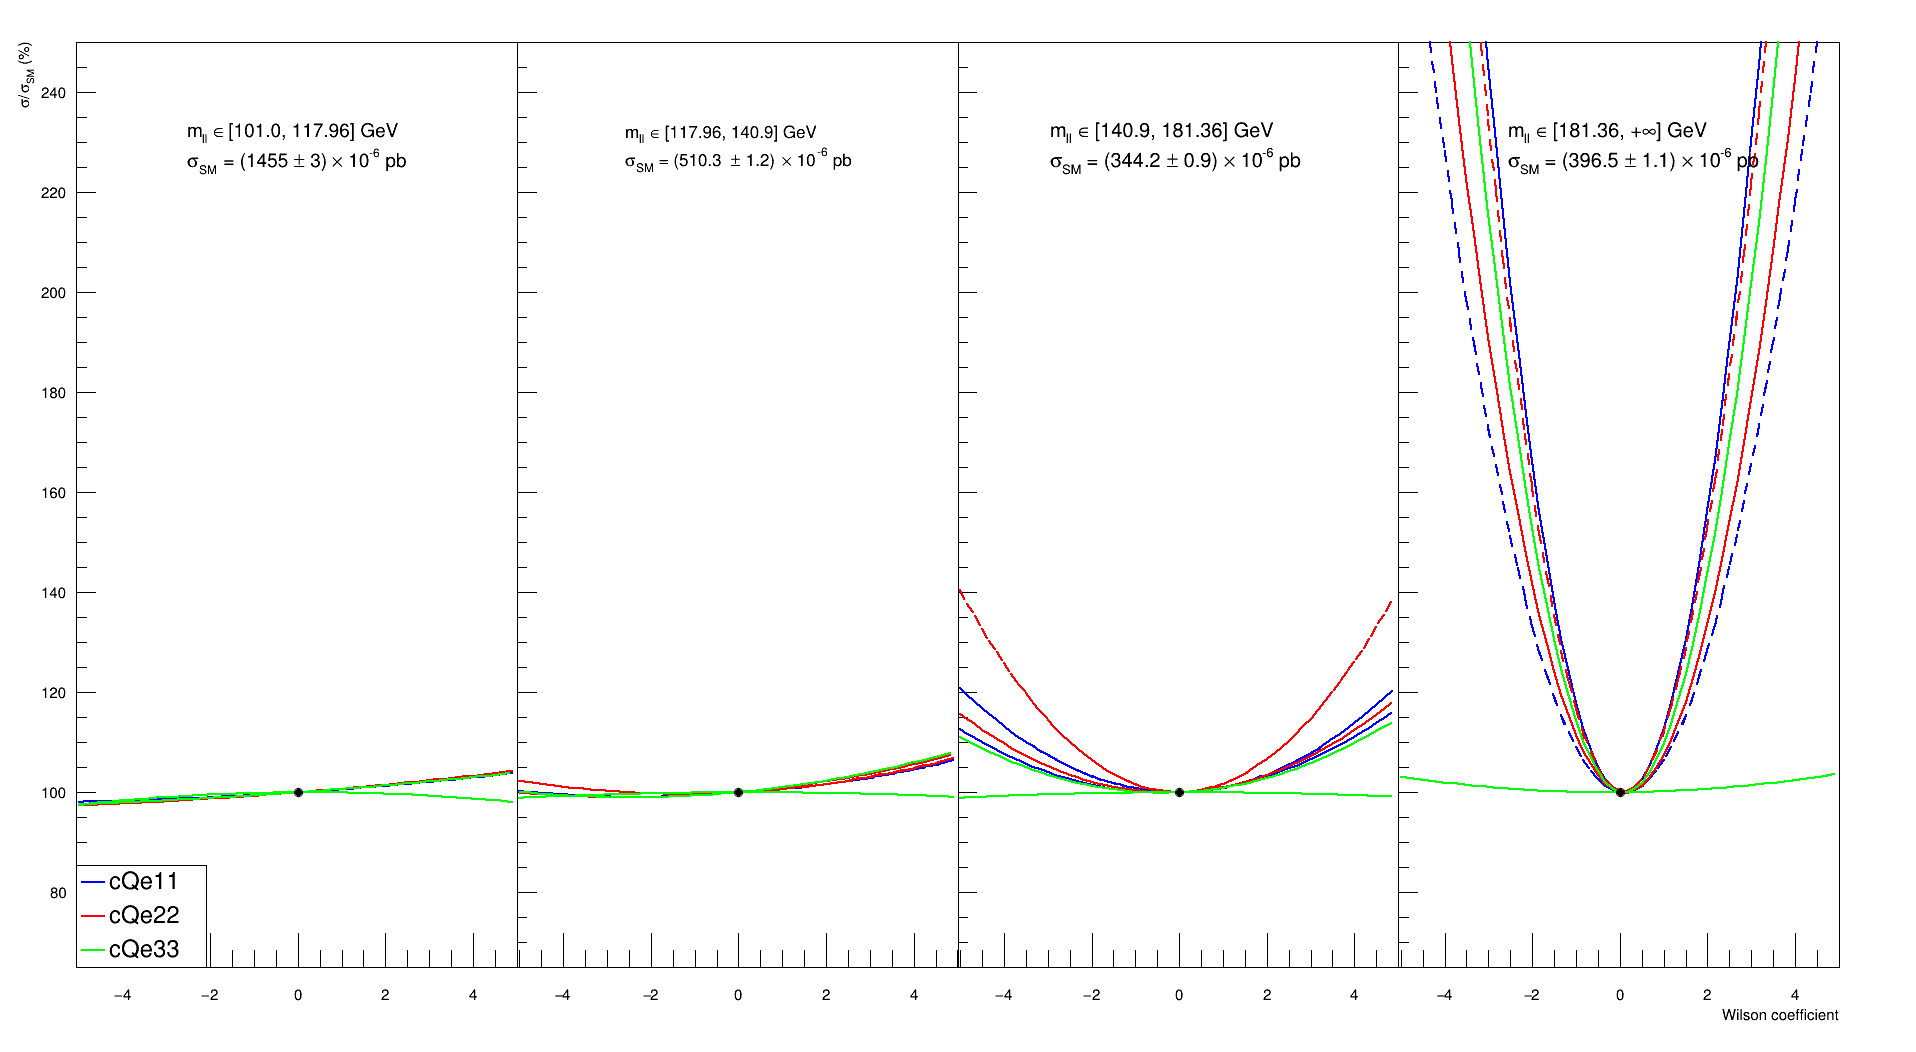
The dotted line corresponds to TGraph->SetLineStyle(2). As you can see, when the parabola is “closed” there is too much space between the dots.
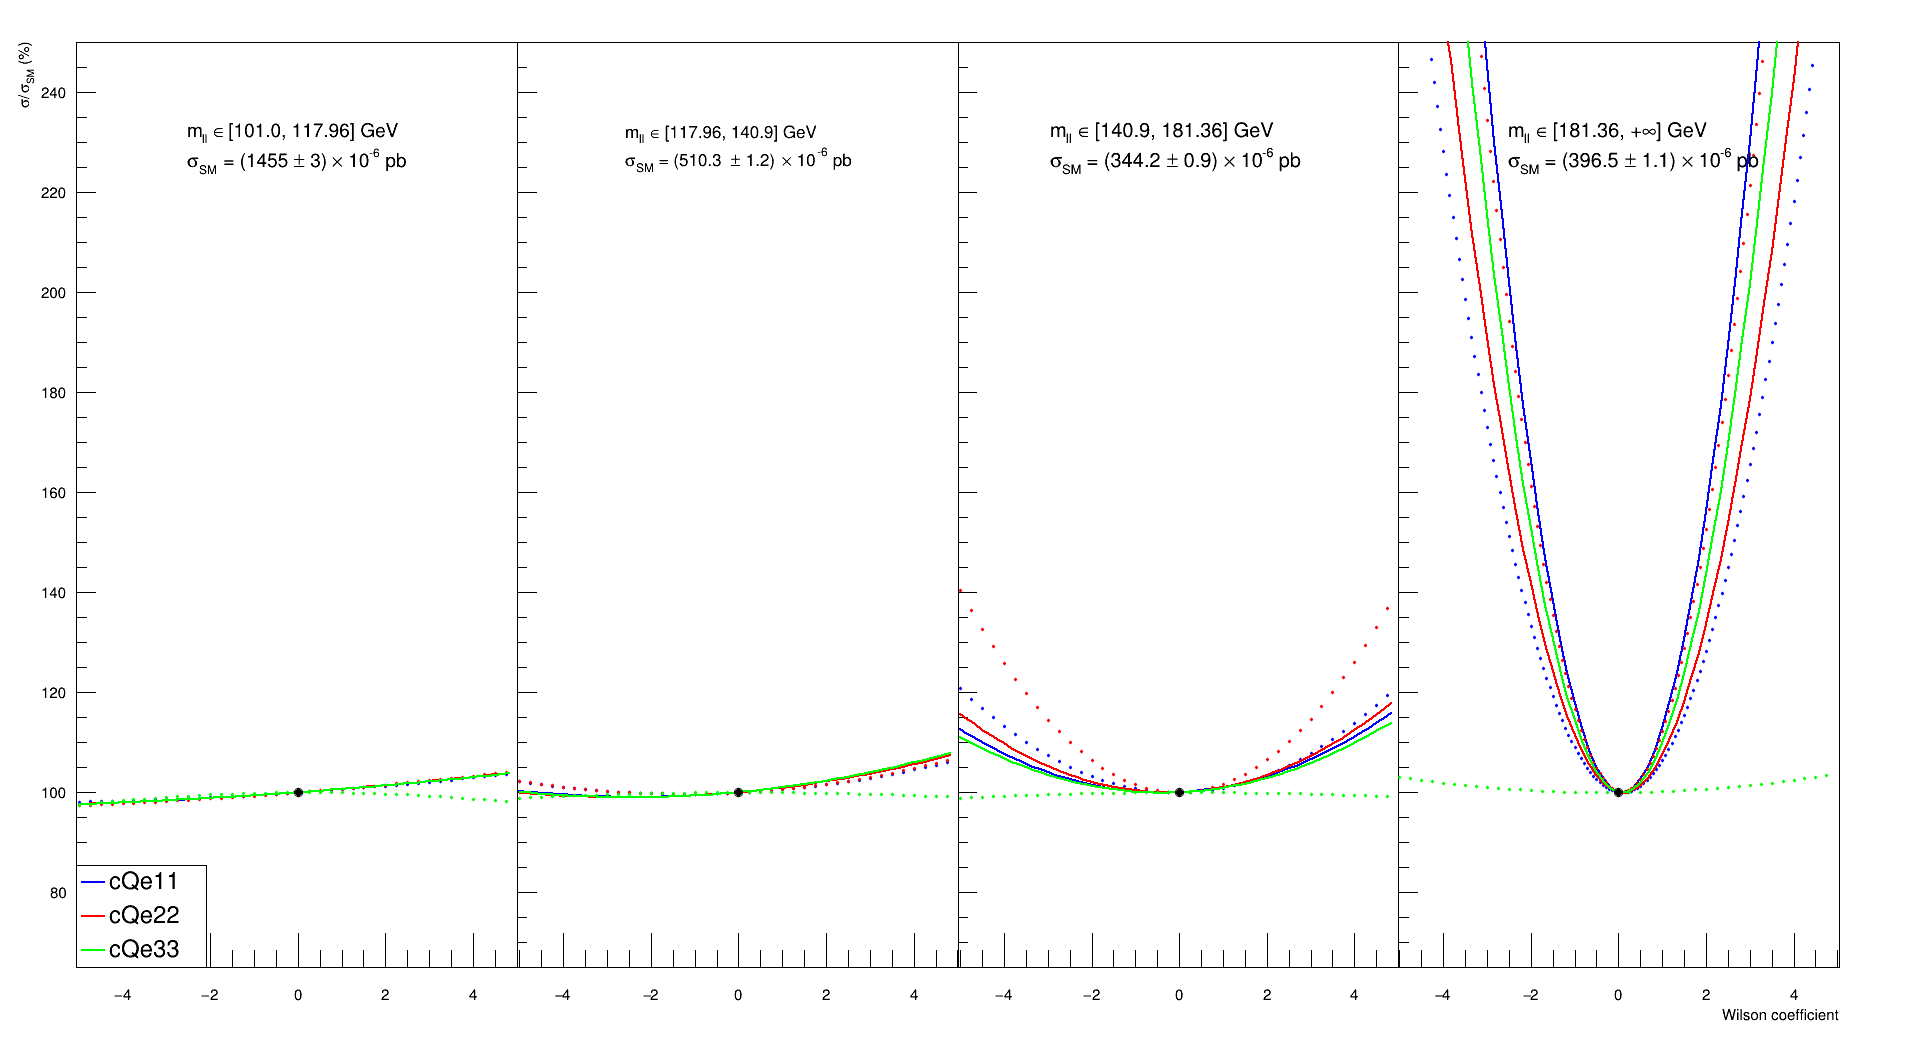
If I try TGraph->SetLineStyle(9):
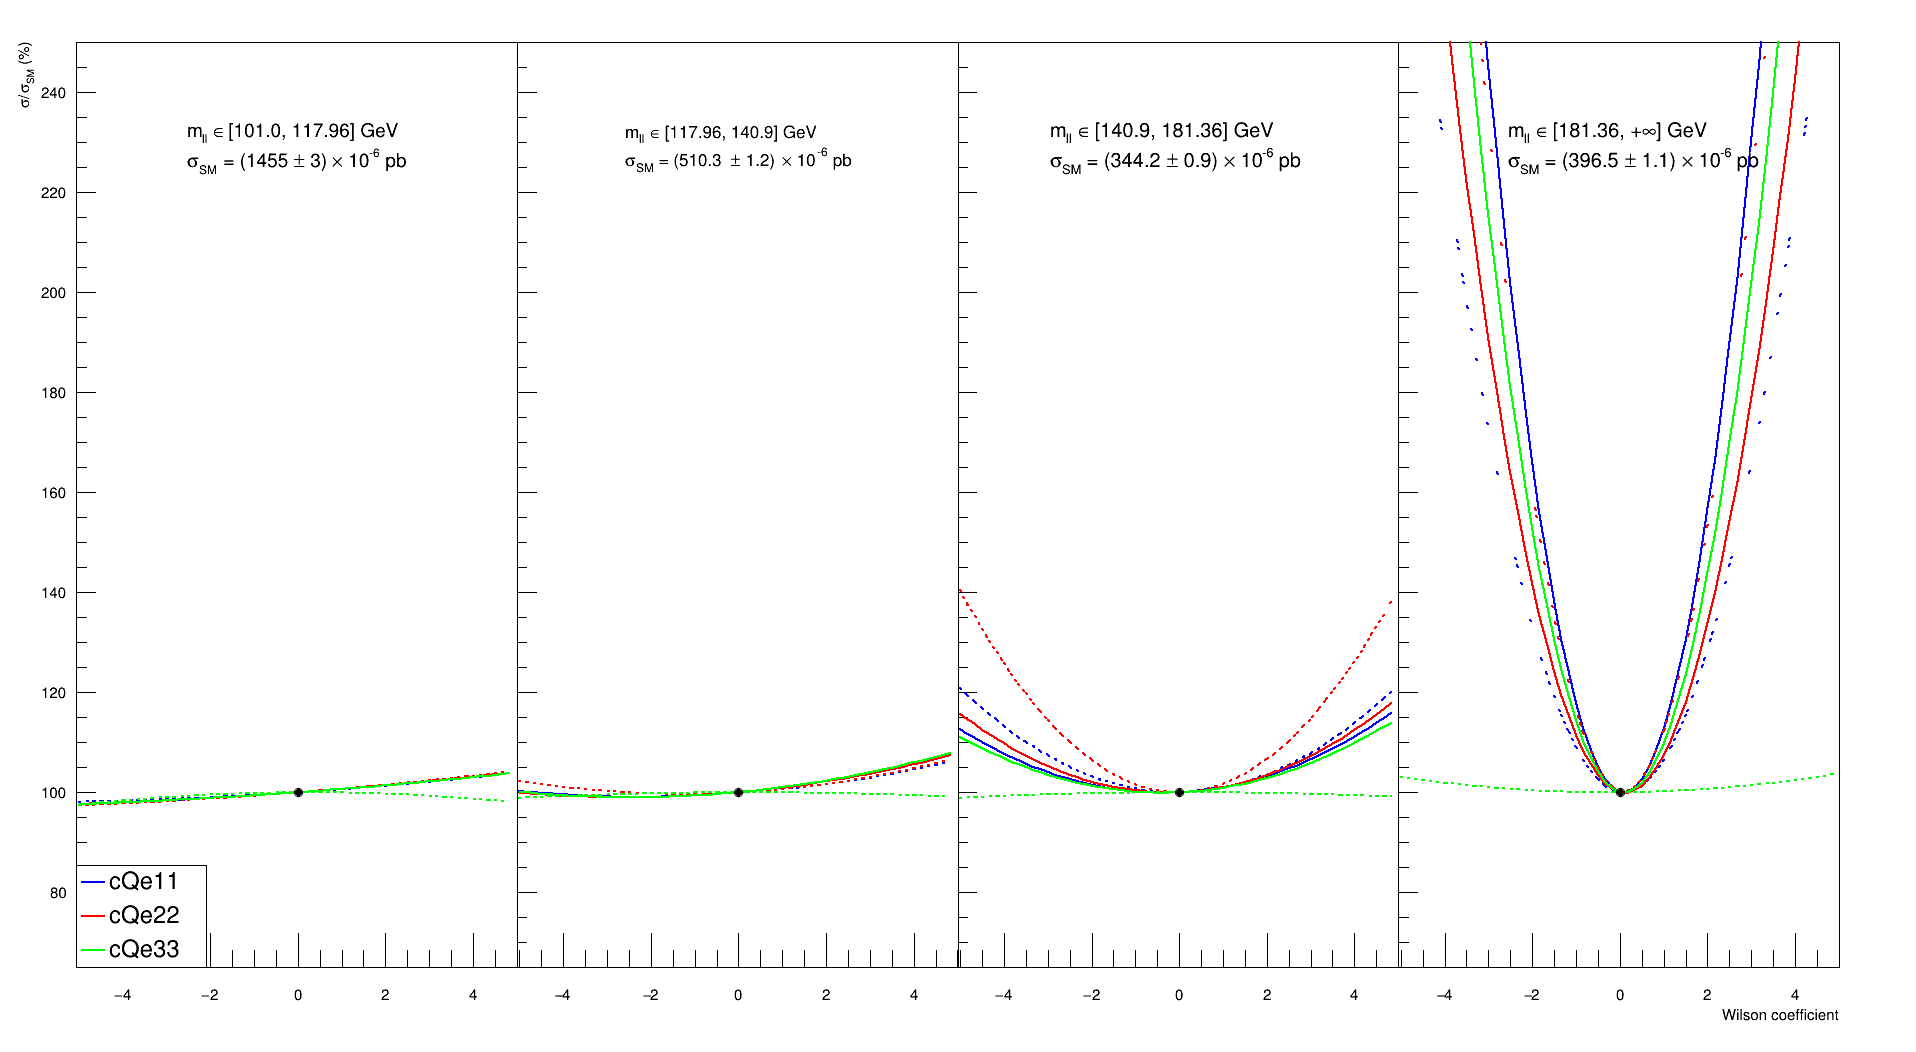
Now the “opened” parabolas seem to be a solid line. I have tried all the deafult styles.
This macro is related to this one.
ROOT Version: 6.24/06
Platform: Debian
Compiler: Not Provided