Hi,
I need to fit a 2D gaussian in my plot. I need to fit three ellipses with sigma, 2 sigma and 3 sigma values of a gaussian fit. Since it is difficult for me to write up everything in words, I have attached the picture of my plot…the code i wrote to fit 2d gaussian function… and my expected plot.
[code]
using namespace std;
// DEFINE 2D GAUSSIAN
Double_t g2(Double_t *x, Double_t *par) {
Double_t r1 = Double_t((x[0]-par[1]));
Double_t r2 = Double_t((x[1]-par[3]));
return par[0]*TMath::Exp(-(par[2]r1r1+par[4]r2r2+par[5]r1r2));
}
//another one:
Double_t G2_662(Double_t *X662, Double_t *Par662) {
     Double_t A = pow(cos(Par662[1]),2)/2/pow(Par662[2],2) + pow(sin(Par662[1]),2)/2/pow(Par662[3],2);
     Double_t B = -sin(2*Par662[1])/4/pow(Par662[2],2) + sin(2*Par662[1])/4/pow(Par662[3],2) ;
     Double_t C = pow(sin(Par662[1]),2)/2/pow(Par662[2],2) + pow(cos(Par662[1]),2)/2/pow(Par662[3],2);
     return Par662[0]*exp(-(A*pow((X662[0]-Par662[4]),2) + 2*B*(X662[0]-Par662[4])*(X662[1]-Par662[5]) + C*pow((X662[1]-Par662[5]),2))) ;
}
void myap(){
TCanvas *c1 = new TCanvas("c1","main",   1920, 1080);
TCut general ="Area>0&&RMS<20" ;
TCut box ="Height<40/0.12207&&Height>20/0.12207&&Area>0" ;

gStyle->SetOptFit(1111);
//
// Plot histo without Elipse Cut //
//
c1->SetLogz();
TH2F *h2 = new TH2F("h2", "Afterpulses", 170,  20, 37, 170, 0, 3000);
h2->SetStats(0);
h2->GetXaxis()->SetTitle("Height [mV]");
h2->GetXaxis()->CenterTitle(1);
h2->GetXaxis()->SetNdivisions(10);
h2->GetXaxis()->SetTitleOffset(1.1);
h2->GetXaxis()->SetTitleSize(0.045);
h2->GetXaxis()->SetTitleFont(42);
h2->GetXaxis()->SetLabelSize(0.045);
h2->GetXaxis()->SetLabelOffset(0.01);
h2->GetXaxis()->SetLabelFont(42);

h2->GetYaxis()->SetTitle("Charge [Signal Electrons x10^{6}]");
h2->GetYaxis()->SetTitleSize(0.045);
h2->GetYaxis()->SetTitleOffset(1.2);
h2->GetYaxis()->SetTitleFont(42);
h2->GetYaxis()->CenterTitle();
h2->GetYaxis()->SetLabelFont(42);
h2->GetYaxis()->SetLabelSize(0.045);
h2->GetYaxis()->SetLabelOffset(0.01);

h2->SetLineColor(kBlack);
h2->SetLineWidth(2);

T1->Draw("0.30347612*Area:Height*0.12207 >>h2", general && box,"colz");
//
// Fit 2D Gaussian //
//
 const Int_t npar_662 = 6;

// parameters for 662keV line (const 200)
Double_t f2params_662[npar_662] = {200, 0.11, 1.4, 100, 27 , 1000}; //const, theta, sigmaX,sigmaY,meanX,meanY
TF2 *g2d_662 = new TF2("g2d_662",G2_662,15,28,500,1000, npar_662);


g2d_662->SetLineStyle(1);
g2d_662->SetLineColor(1);
g2d_662->SetLineWidth(1);
g2d_662->SetFillColor(2);
g2d_662->SetParameters(f2params_662);

g2d_662->SetParNames("const","theta","sigma X", "sigma Y", "mean X", "mean Y");


h2->Fit(g2d_662, "RNOQ+");
h2->Draw("COLZ");

g2d_662->SetNpx(1000);
g2d_662->SetNpy(1000);
//g2d_662->Draw("CONT3 SAME");

cout <<"662 keV:"<< endl <<"---------"<< endl;

double Theta662         = g2d_662->GetParameter(1);
double Theta662er         = g2d_662->GetParError(1);
double Theta662_deg     = Theta662*180/TMath::Pi();
double Theta662er_deg    = Theta662er*180/TMath::Pi();
cout <<"Theta  = "<< Theta662_deg <<" +- "<< Theta662er_deg <<" deg"<< endl;

double TanTheta662 = tan(Theta662);
//double TanTheta662 = tan(TMath::Pi()/2-Theta662);
cout <<"Tangent Theta  = "<< TanTheta662 << endl;

double meanX662 = g2d_662->GetParameter(4);
cout <<"mean X = "<< meanX662 << endl;
double meanX662er = g2d_662->GetParError(4);

double meanY662 = g2d_662->GetParameter(5);
cout <<"mean Y = "<< meanY662 << endl;
double meanY662er = g2d_662->GetParError(5);

double sigmaX662 = g2d_662->GetParameter(2);
cout <<"sigma X = "<< sigmaX662 << endl;

double sigmaY662 = g2d_662->GetParameter(3);
cout <<"sigma Y = "<< sigmaY662 << endl;

double sinTheta662 = sin(Theta662);
double cosTheta662 = cos(Theta662);
cout <<"sin Theta = "<< sinTheta662 << endl;
cout <<"cos Theta = "<< cosTheta662 << endl;


char slope662_char[500];
sprintf(slope662_char, "-%f*((x)-%f)+%f", TanTheta662, meanX662, meanY662);
//
// Plot histo with Elipse //
//
TF1 *slope662 = new TF1("slope662", slope662_char, 0, 3000);
slope662->SetLineColor(1);
slope662->SetLineWidth(1);
slope662->SetNpx(1000);
// slope662->Draw(“same”);
TEllipse *ell662_1sigma = new TEllipse(meanX662, meanY662, sigmaX662, sigmaY662, 0, 360, -1*Theta662_deg);
          ell662_1sigma->SetFillStyle(0);
       //   ell662_1sigma->SetLineStyle(9);
          ell662_1sigma->SetLineColor(1);
          ell662_1sigma->SetLineWidth(4);
          ell662_1sigma->Draw("same");

TEllipse *ell662_2sigma = new TEllipse(meanX662, meanY662, 2*sigmaX662, 2*sigmaY662, 0, 360, -1*Theta662_deg);
          ell662_2sigma->SetFillStyle(0);
     //     ell662_2sigma->SetLineStyle(9);
          ell662_2sigma->SetLineColor(1);
          ell662_2sigma->SetLineWidth(4);
          ell662_2sigma->Draw("same");

TEllipse *ell662_3sigma = new TEllipse(meanX662, meanY662, 3*sigmaX662, 3*sigmaY662, 0, 360, -1*Theta662_deg);
          ell662_3sigma->SetFillStyle(0);
   //       ell662_3sigma->SetLineStyle(9);
          ell662_3sigma->SetLineColor(1);
          ell662_3sigma->SetLineWidth(4);
          ell662_3sigma->Draw("same");

          ell662_1sigma->Draw("same");
          ell662_2sigma->Draw("same");
          ell662_3sigma->Draw("same");
}[/code]
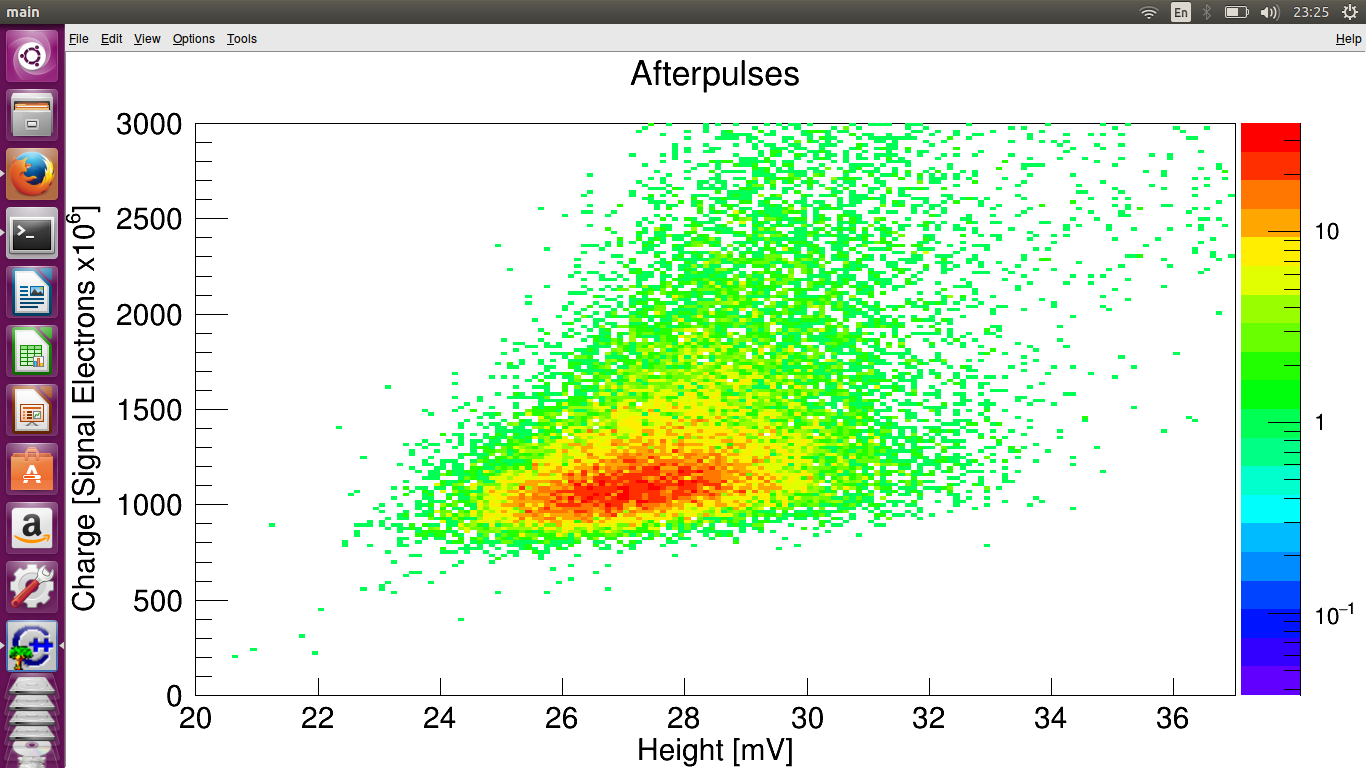
My plot without gaussian fit:
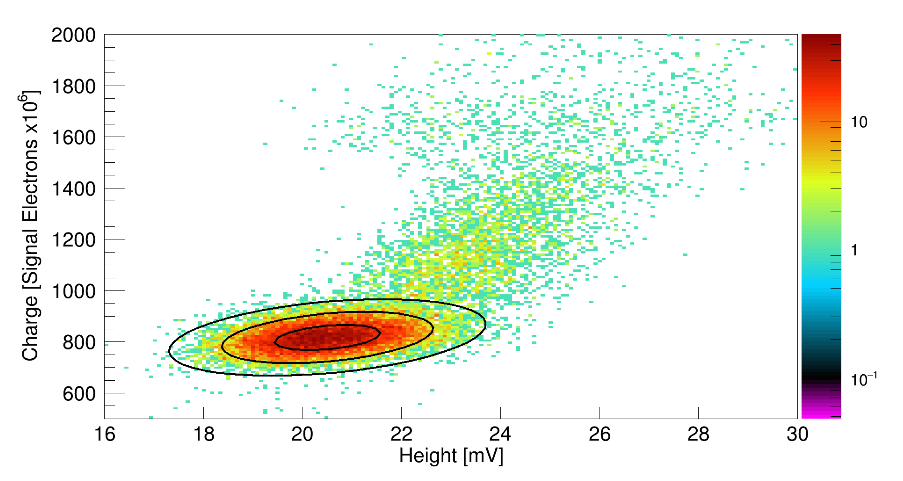
my expected plot after fitting 2d gaussian function:
Using the above given parameters of sigmaX, sigma Y, meanX, meanY, I am still unable to get a correct fit for the plot. My code is long, but still could you please go through it and correct me if i am wrong?
Thank you in advance!