2-D Gaussian fit to a data file

Hi,

I plot a data file using TGraph2D(), the file has three columns and I can plot this file without problem.

TGraph2D *g = new TGraph2D("datafile.dat");
 g->Draw("surf1z");

I want to do a 2-D gaussian fit to this graph to obtain constant, mean and sigma values.

Is there any way to make it??

Thanks,

Manuel

Create a double gaussian like

TF2 *f2 = new TF2("f2","[0]*TMath::Gaus(x,[1],[2])*TMath::Gaus(y,[3],[4])",0,10,0,10); f2-<SetParameters(1,3,1,4,1); g->Fit(f2);
Rene

Hi Rene,

I did as you said, with the following results:

EXT PARAMETER APPROXIMATE STEP FIRST NO. NAME VALUE ERROR SIZE DERIVATIVE 1 p0 7.82702e+01 4.65184e+05 3.24934e+00 1.24906e-10 2 p1 -4.24749e+00 1.08480e+03 2.28853e-01 5.14651e-08 3 p2 9.99192e-01 1.08488e+02 1.47939e-01 2.86447e-07 4 p3 7.23658e+00 3.88612e+03 2.87589e-01 -4.53026e-09 5 p4 2.41924e+00 6.49284e+04 4.96411e-01 -3.64138e-09

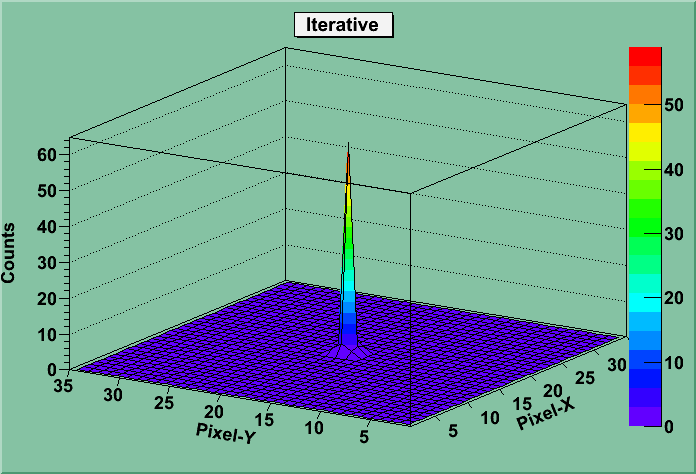
So, in this table, p0 corresponds to the amplitude (in this case, 2-D, it is the peak height) of approximately 78 and p1 is the mean value in the x-axis, it is a negative value. I do not understood what happens, because the mean value in the x-axis is approximately 17 and why the amplitude value is 78 if the peak height in the graph is about 58??

I attach the graph.

Thanks for your attention

Manuel


Hi,

to have a correct fit you need to provide some errors for your data points, for example 0 for x and y and sqrt(z) for z if z represents counts). Then you can fill and then fit a TGraph2DErrors. Without errors all the points have the same weights and the function will be pushed towards the tails

Best Regards

Lorenzo

Hi,
I’m also having problems with drawing 2D gaussians (nothing to do with fitting). The amplitude drawn is most of the time completely different from the one set.
For example
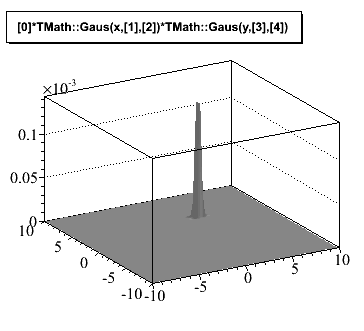
TF2 *f2t = new TF2(“f2t”,"[0]*TMath::Gaus(x,[1],[2])*TMath::Gaus(y,[3],[4])",-10,10,-10,10);
f2t->SetParameters(0.9,3,.22,4,.03);

Gives me the attached figure (amplitude of .1 e-3). if I do cout<<" par0:"<< f2t->GetParameter(0);
this returns me the correct set amplitude ie: 0.9. Does anybody know what I might be doing wrong?
Many Thanks,
Sebastien

Hi,

your gaussian has a very small width in the y direction. You should decrease the range in x and y. For example plot between -10 and + 10 sigma in x and y and you will get a right plot. Or you can increase the precision of th e plot by using more points. For example do
f2t->SetNpy(1000)

but it will take a longer time to draw

Best Regards

Lorenzo

Hi,
Yes thanks it works fine with SetNpy()…
Best,
Sebastien

Hello I trying to create a 2D Gaussian where x and y are dependent on each other with the variable “rho”.

TwoDGaus=ROOT.TF2("TwoDGaus","[0]*TMath::Exp(-1/(2(1-TMath::Power([1],2))*(TMath::Power((x-[2]),2))/TMath::Power([3],2)+TMath::Power((y-[4]),2))/TMath::Power([5],2)-(2*[1]*(x-[2])*(y-[4]))/([3]*[5]))",0,10,0,10)

But I am getting a error messages: has 0 parameters instead of 2.
I was hoping to save my self some headache, So I was wondering if there is a pre-difinde function for this in ROOT? I am unable to find one in the TMath library. Dose any one have knowledge of this. I am using Pyroot if that changes anything.

Thanks,
-F

Note that there is a ROOT function called

which is the bivariate normal distribution that you want to use.

(Since March 16):
root.cern.ch/gitweb/?p=root.git … ad7c858db9
root.cern.ch/gitweb/?p=root.git … 41364ea63c

Note that there is a ROOT function called

bigaus

which is the bivariate normal distribution that you want to use.

(Dont know why the previous post is corrupted)