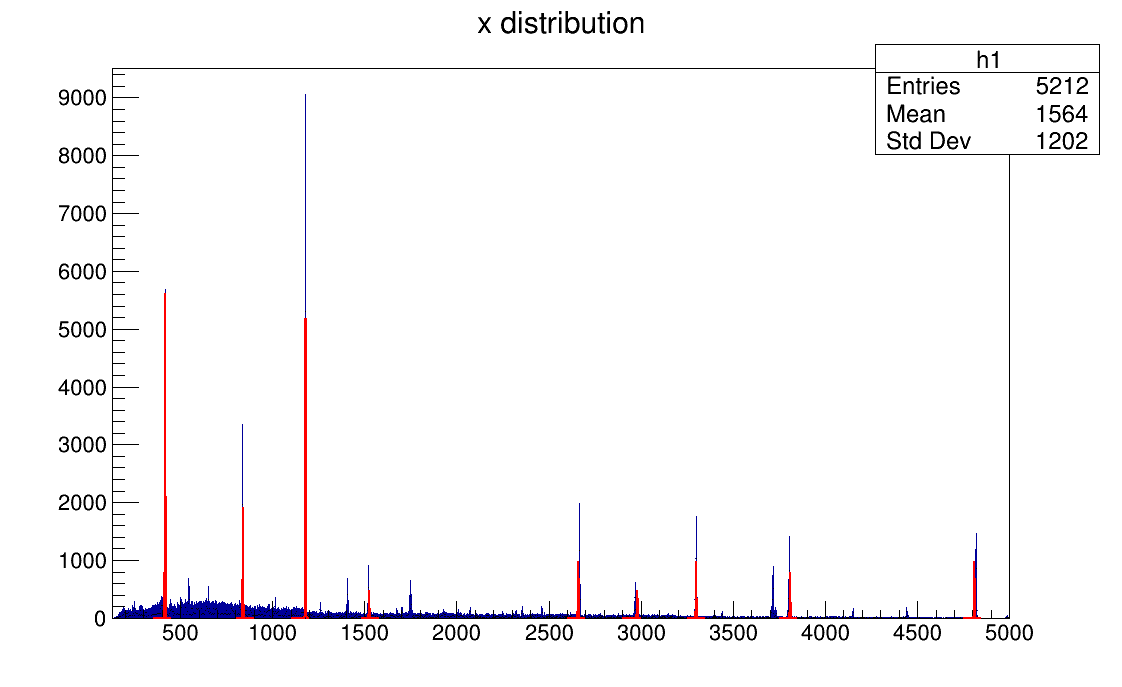
I have drawn a histogram that has a number of peaks and now i want to fit each peak.
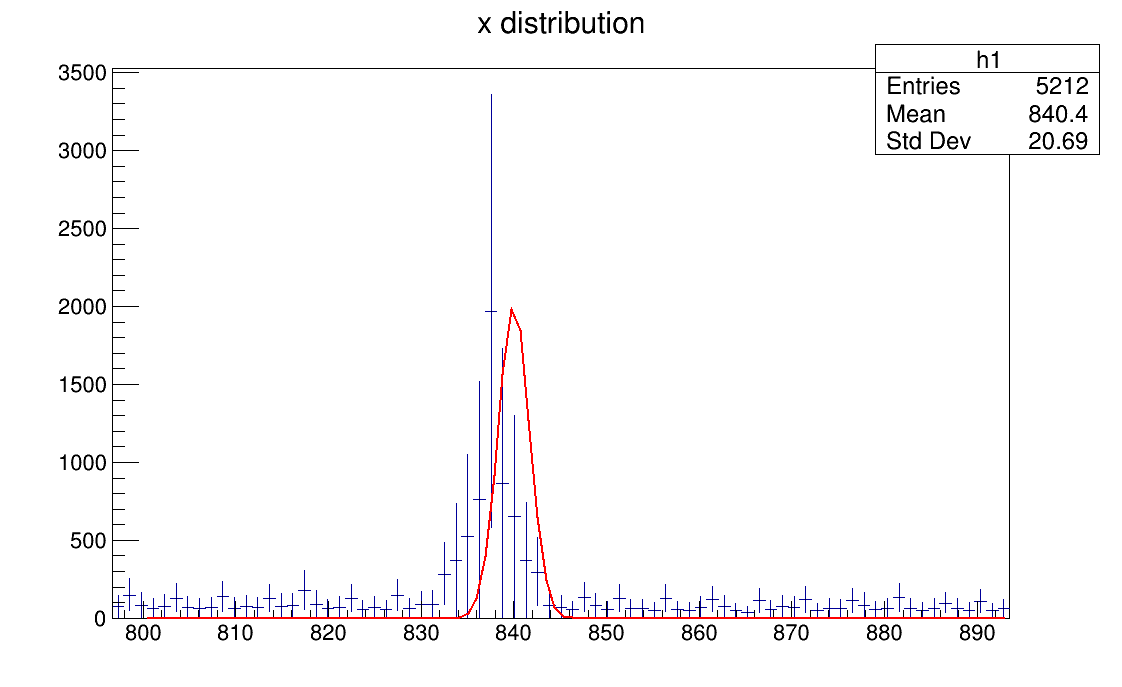
Let’s start with only one peak. I have chosen one of the peaks.
I also have given initial parameters and it has plot the given function according to the given parameters.
So it is not the correct fitting.It is only a kind of simulation.
What i want is when i give initial parameters to it. It should my function according to those given parameters.
Help me!!!
_ROOT Version:6.14
_Platform:Ubuntu Compiler: Not Provided
It is difficult to help you without an example showing what you are doing. I can suggest you to look at the fit tutorials. Many of them deal with the same kind of problem you are explaining here.
This is not showing the exact fitting curve it is just showing the range that i have given in g3 function in the code.
How is it possible to fit this peak so that it automatically takes the parameter?
What is hist.C supposed to do ? I see you define gaussians and draw them. But there is no fitting (and no data) .
May be @moneta would have an idea about what you are trying to show with that code.
The fits should work if you set the function parameters and range that make sense. Note that I am using the option “+” to add all the functions to the histogram