Dear rooters,
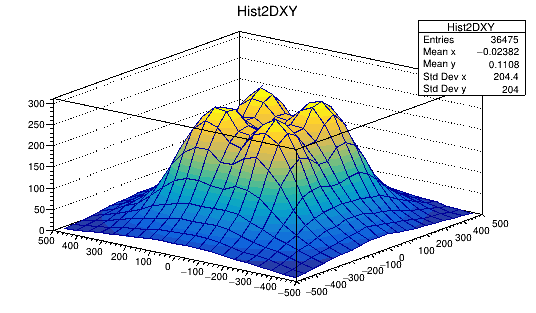
I am having a 2D histogram which is having multiple peaks.
Using the ShowPeaks() function of i am able to see the marker comes at peak position.
but how to get the values of Peaks position programmatically.
I had gone through similar topic in the forum, but didn’t get any information on finding the
peak position.
Function to find the Peaks belongs to TSpectrum but TH2F does not give any pointer
to the Spectrum.
Could you please help me regarding how to programmatically get the number of peak and their location
from TH2F.
Thanks a lot,
Following that example now i am able to get peaks location.
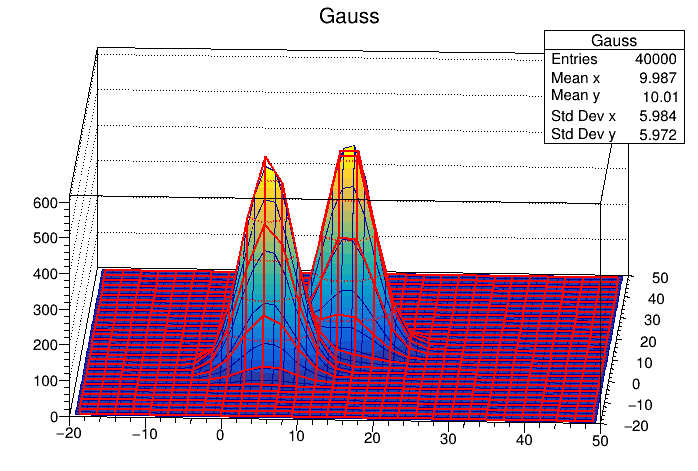
Can you also please suggest how to fit different gaussian to these peaks
So that i can get mean and sigma of individual gaussian fitted peak.
My overall target is as follows:
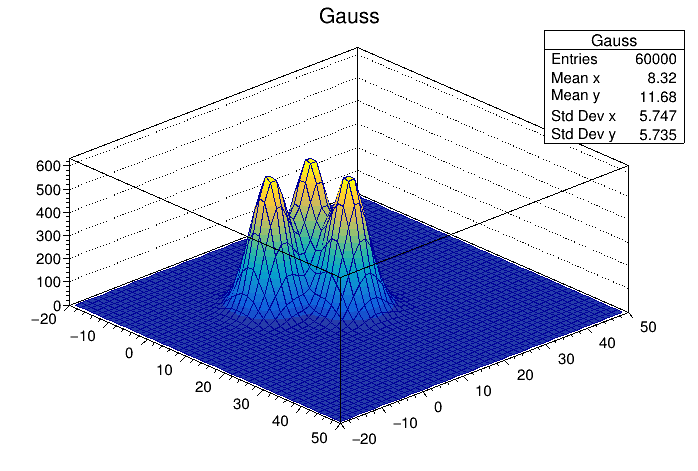
I am having 2D histogram which using DrawPanel of ROOT browser i am able to see 4 peaks
something like 4 gaussian, Now i want the mean and sigma of the gaussian that fits these peaks
But when i tried to fit 3 , 2D gaussian on then getting an error like
error: no matching member function for call to ‘SetParameters’
oot-6.14.04/build_root-python-2.7/include/TF1.h:633:21: note: candidate function not viable: requires at most 11 arguments, but 15 were provided
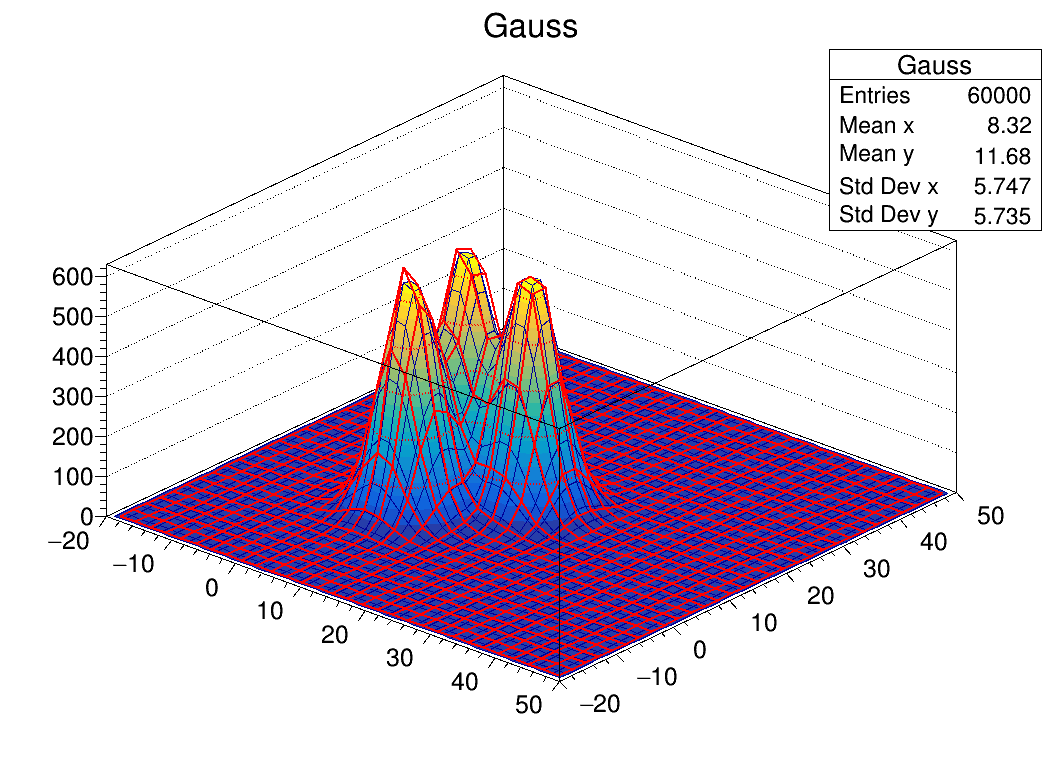
I am able to fit 3 TwoD gaussian.
The problem was with the SetParameter function that i was using previously, which accepts maximum 11 parameter, then i found in in TF2 class that there is another overloaded SetParameters function which take the array of Parameters, after using that i works perfectly fine and as expected. Below is the image for the reference. Thanks again for helping me in this