Filled contour drawn on top

Hi,

I want to add a filled contour drawn on the top… using Surf3.

TH2D *p1=(TH2D *)input1->Get(“cellhist2D”);
TH1D *plot1 = p1->ProjectionX();
plot1->SetName(“plot1”);
plot1->Draw(“Lego2”);

After this, adding p1->Draw(“Surf3 same”), is not working. Any idea?


ROOT Version: Not Provided
Platform: Not Provided
Compiler: Not Provided


“plot1” is a TH1D… We cannot draw a contour with a 1D histogram.
TH1D can be drawn as lego plots but that’s just to get some 3D effect on bins.
That doesn’t bring any additional information.

Thanks. Is there any way to plot the 2D on the top instead of drawing contour?

On the top of what ?

You are not drawing any contour in the example you sent. So… “instead” of what ?

Can you provide some running macro showing your problem and/or a picture showing what you want to obtain ?

TH2D *p1=(TH2D *)input1->Get(“cellhist2D”);
TH1D *plot1 = p1->ProjectionX();
plot1->SetName(“plot1”);
plot1->Draw(“Lego2”);

I want to plot a 2D (here p1) on the top of the Lego2 plot (here plot1). Is it possible?

Sandy,
I think you want something looking like the plot here, right?

Drawing a surface (p1 in your case) needs 2 axes (x and y), yet plot1 is 1D. Even when plot1 is drawn as lego there is only one axis (x; of course, ignoring the height, z); the “depth” is not a binned axis, but just an effect to make it look 3D, so where/how would the “y” bins be shown?
Instead, maybe you can copy plot1 into another 2D histogram, but using only one y bin, e.g. use y=0 for all x bins; then probably you can draw what you want.

Hi dastudillo,
Yes, something like that.
I am getting the 3D lookalike by using Lego2 in plot1 (which is 1D). But, I can’t plot p1 (which is 2D) on the top.

You can try to use the last macro posted in the thread @dastudillo mentioned.

Thanks @couet and @dastudillo, now if I want to draw vertical transparent planes in the plot @dastudillo mentioned, at Y=5 (with Z=4, colour blue) and at Y=7 (with Z=8, colour yellow), then what would be the modifications in the following?

Double_t plane(Double_t *x, Double_t *par){
if (3.98<x[1] && x[1]<4.02) return 1000.;
return 0.;
}

TF2 *myPlane = new TF2(“myPlane”,plane,200.,300.,-0.2,2.,0);
myPlane->SetLineColor(1);
myPlane->SetNpy(100);
myPlane->SetNpx(4);
myPlane->Draw(“lego4 0 sames”);
myPlane->SetFillColorAlpha(kBlue, 0.0001);
myPlane->SetLineColorAlpha(kBlue, 0.);

What is “the plot” ? a lego plot ?

Yes, the lego plot @dastudillo mentioned in his reply.

You want to dow the plane as a lego plot ?

I just want two vertical transparent planes standing inside those lego tubes at the mentioned positions.

Something like this?

or like this?

or something else?

1 Like

The second one will do. Now the heights of both the planes are same. Can it be made different? And can any transparent color (light) be put on the planes? Thank you.

And can the planes be of no widths?

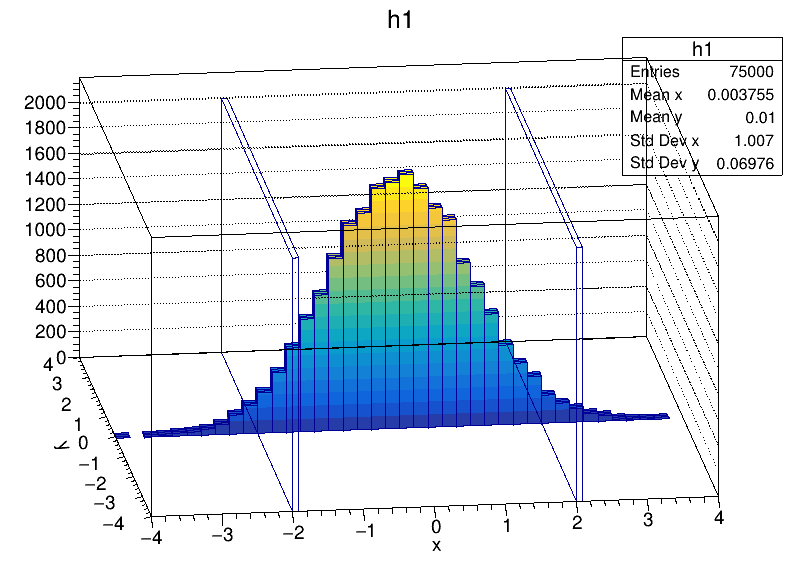
This is the code for the second plot:

{
   auto c2 = new TCanvas("c2","c2",800,600);
   auto h1 = new TH2F("h1","h1",40,-4,4,100,-4,4);
   auto h5 = new TH2F("h5","h5",100,-4,4,1,-4,4);
   auto h7 = new TH2F("h7","h7",100,-4,4,1,-4,4);
   Float_t px, py;
   for (Int_t i = 0; i < 25000; i++) {
      gRandom->Rannor(px,py);
      h1->Fill(px,-0.07);
      h1->Fill(px,0);
      h1->Fill(px,0.1);
   }
   h1->GetXaxis()->SetTitle("x");
   h1->GetXaxis()->SetTitleOffset(1.5);
   h1->GetYaxis()->SetTitle("y");
   h1->GetXaxis()->CenterTitle();
   h1->GetYaxis()->CenterTitle();
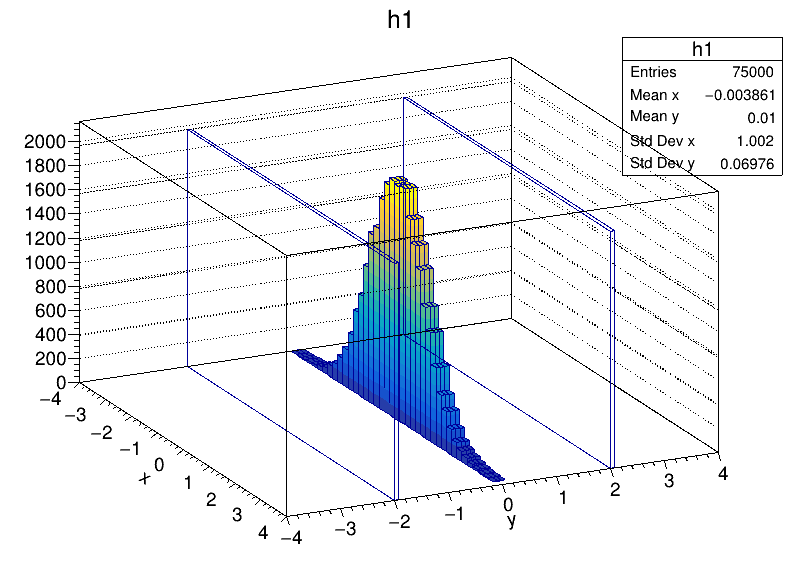
   h1->Draw("lego2,0");
   h5->Fill(-2,1);
   h5->Draw("lego,0,same");
   h7->Fill(2,1);
   h7->Draw("lego,0,same");
}

As you can see, the “planes” are just histograms with very narrow bins along “x” (but only one is filled, at the position where you want the plane) and one fat bin along “y” (covering the depth you want). With this method, they cannot be “real” planes with no thickness; you can just try to make them as thin as possible, but since I used the same width for the “real” histogram (h1), I had to fill a few “y” bins with the same values, so that the histo looks thicker than the “planes”. This can be improved by making larger y-bins in h1, so that you don’t need to fill it several times.
There may be a better way to get the “planes”, but this is what I came up with :slight_smile:
Also, with this method I’m not sure whether you can make the planes with different colours. To get different heights perhaps you can normalise (on the z-axis) everything so they are all at the same scale and the heights can be relative to each other. Maybe you can play around, or an expert can give a better solution.
EDIT: Try, for instance:

   auto h1 = new TH2F("h1","h1",40,-4,4,8,-4,4);
   auto h5 = new TH2F("h5","h5",500,-4,4,1,-4,4);
   auto h7 = new TH2F("h7","h7",500,-4,4,1,-4,4);

and fill h1 only with h1->Fill(px,0); (remove the filling at the -0.7 and 0.1 bins).

Thanks. Yes, changing the z-height causes it to be thinner. And if planes were to be parallel to x axis then what change would be there? @dastudillo

Just invert the x and y binning of h5 and h7:

   auto h5b = new TH2F("h5b","h5b",1,-4,4,500,-4,4);
   auto h7b = new TH2F("h7b","h7b",1,-4,4,500,-4,4);
   ...
   h5b->Fill(1,-2);
   h5b->Draw("lego,0,same");
   h7b->Fill(1,2);
   h7b->Draw("lego,0,same");

By the way, in case you wonder, when filling with (1,2) etc. the “1” can be any value within the range of the histogram (-4 to 4 in this case).
Cheers,
Daniel

How do I get rid of the straight lines at the back-planes?