That’s not really easy to do. What I can propose is something like that:
{
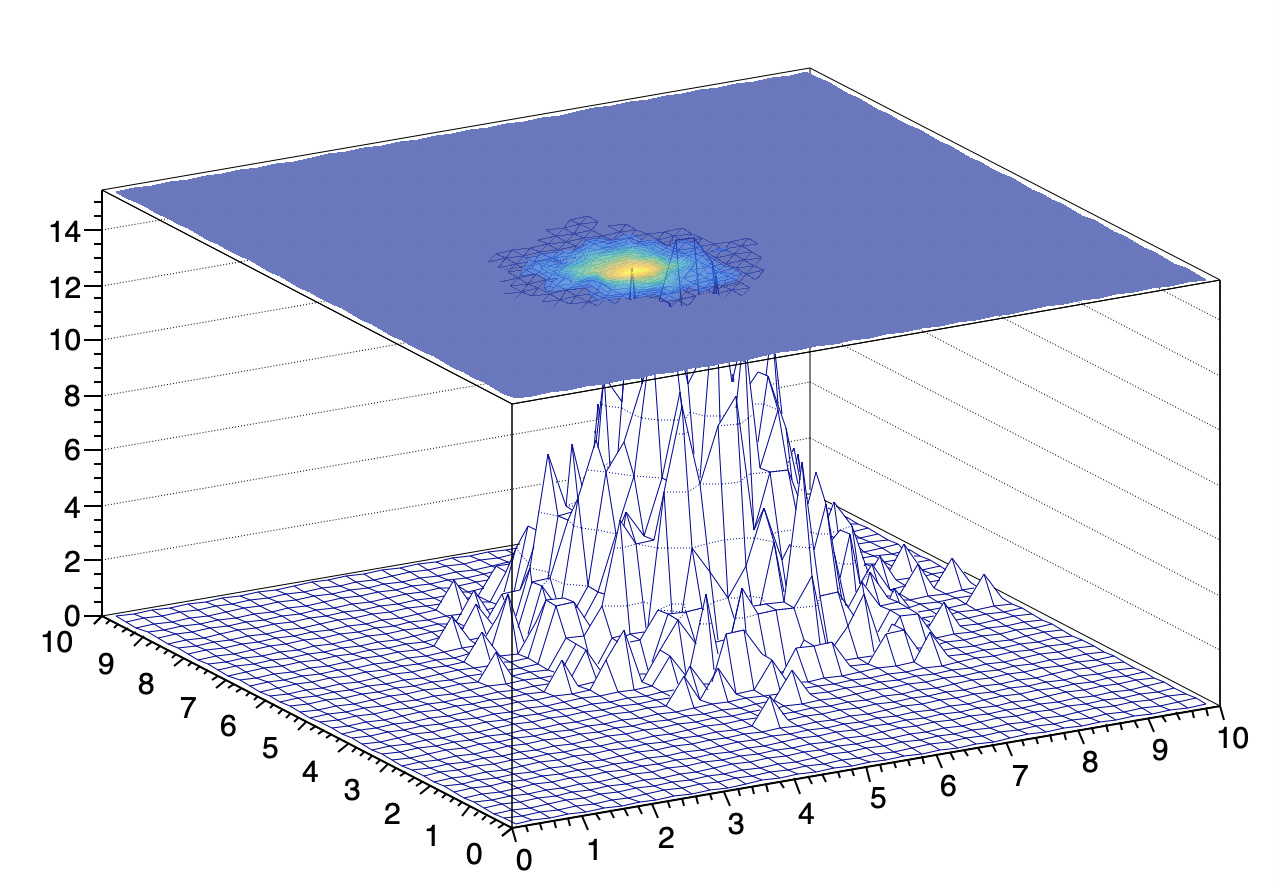
TH2F *h1 = new TH2F("h1","",40,0,10,40,0,10);
TH2F *h2 = new TH2F("h2","",40,0,10,40,0,10);
for(int i =0; i<1000; i++) {
h1->Fill(gRandom->Gaus(6,1),gRandom->Gaus(6,1));
h2->Fill(gRandom->Gaus(4,.5),gRandom->Gaus(4,.5));
}
h2->SetLineColorAlpha(22,0.);
gStyle->SetPalette(kBird,0,0.7);
h1->Draw("surf");
h2->Draw("surf3 same");
}