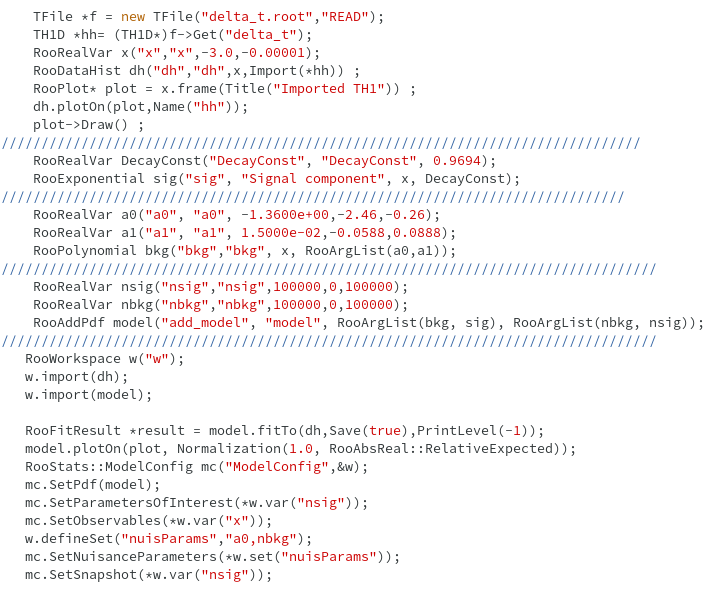
I have a histogram showing time difference window in the negative x-axis i.e. from -3 sec to -10 micro- sec. I was looking for exponentially decaying structure of specific gamma line but didn’t find any exponential behaviour and now I’m trying to put upper limit of Number of signal counts using Maximum likelihood Model:
As here i have negative x-axis, should i fit the data with positive exponential function i.e. N = N0 * exp(lambda*x) instead of negative sign with exp function or the fit function automatically do it for me?
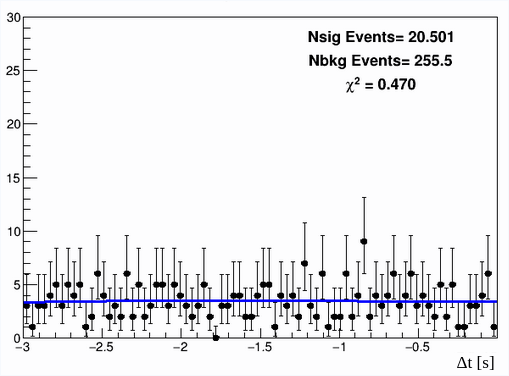
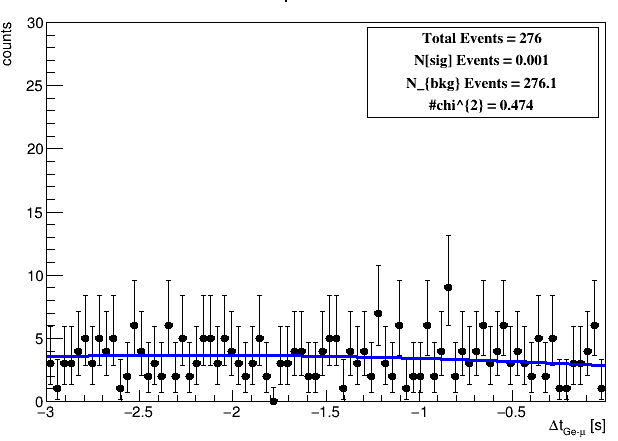
Following is the plot i got with the fitted model with
Yes if you want an exponential going to zero for x going to - infinity, then you need to use a positive decay constant for the RooExponential pdf. It is better you set as initial parameter for the fit already a positive value which is bound to not be negative.
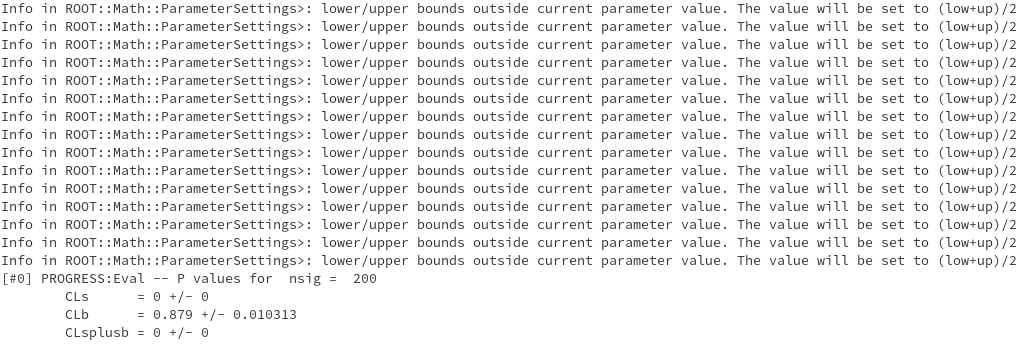
So, after that i’m running StandardHypoTestInvDemo.C to find upper limit on number of signal counts with frequentist approach. But i’m getting these messages for it.
No it is not fine having these messages. It seems you are trying to set a parameter value outside its given range. This is happening before fitting. I would check that you have set correct bounds for all the parameters
And after using negative decay constant value for exponential, i got this plot. Here if you see Kai^2 value, it shows the fit is good but number of signal events in this case is reduced which will also affect upper limit. I’m not sure which one is the correct approach.
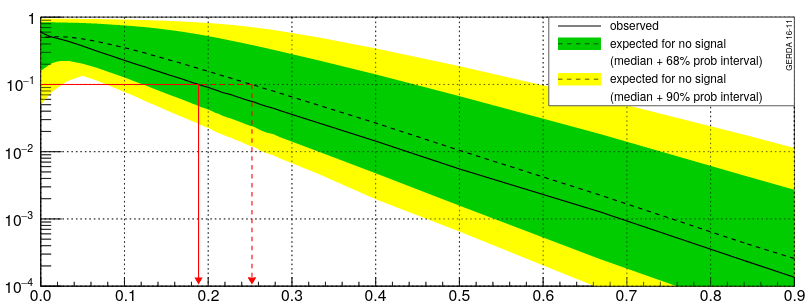
I have one more question may be a more basic one I want to change legend of p-value plot like the one shown below. Is there any chance that i can change it in StandardHypoInvDemo.C according to my style.
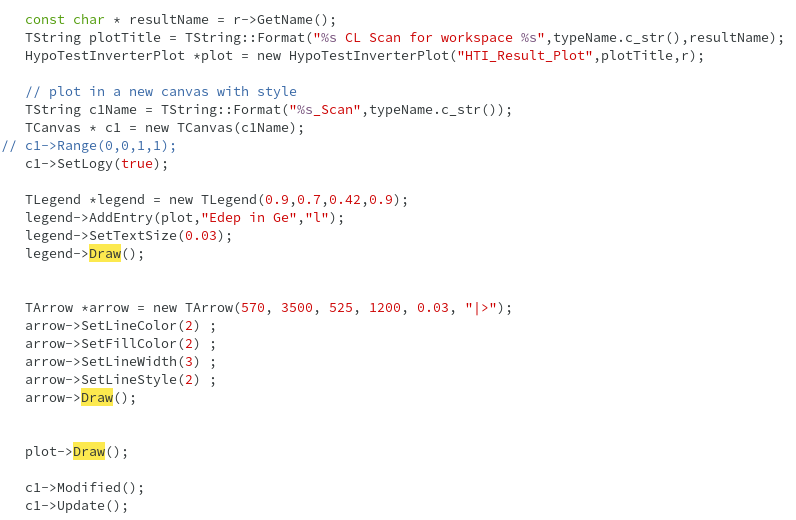
I tried to add arrow and legend/PaveText to the plot and alse tried to modified and update canvas but nothing is happening to the p value plot. Its remains the same. Also added some include files related to them. And also tried using different coordinate system for Canvas but in vain.
Hi,
I think you should add the legend and the arrow after having called plot->Draw(), otherwise when plotting the HypoTestInverterPlot object it might recreate the pad.
Try doing this and if it does not work we might need the help of @couet.
I want to change legend in p value plot drawn by StandardHypoTestInvDemo.C and also want to add arrows showing upper limit and expected upper limit like the one shown in the figure below.
I am trying to do it in the same macro but legend and arrows are not appearing on the plot.
Also could you tell me where all these cosmetics are done for this p value plot so that i can simply change text in that or change it according to my style.
 I want to change legend of p-value plot like the one shown below. Is there any chance that i can change it in StandardHypoInvDemo.C according to my style.