Dear ROOT experts,
I would like to simply draw 2 histograms as following :
h_27[0].Draw()
h_27[1].Draw(“same”) BUT in the Y-axis. 1 histogram is red filled and the other is only a dashed-line appearance to be visible on top of the other as shown by the plot1 here : summaryDisco_onlyHELHC_15_X.pdf (14.6 KB)
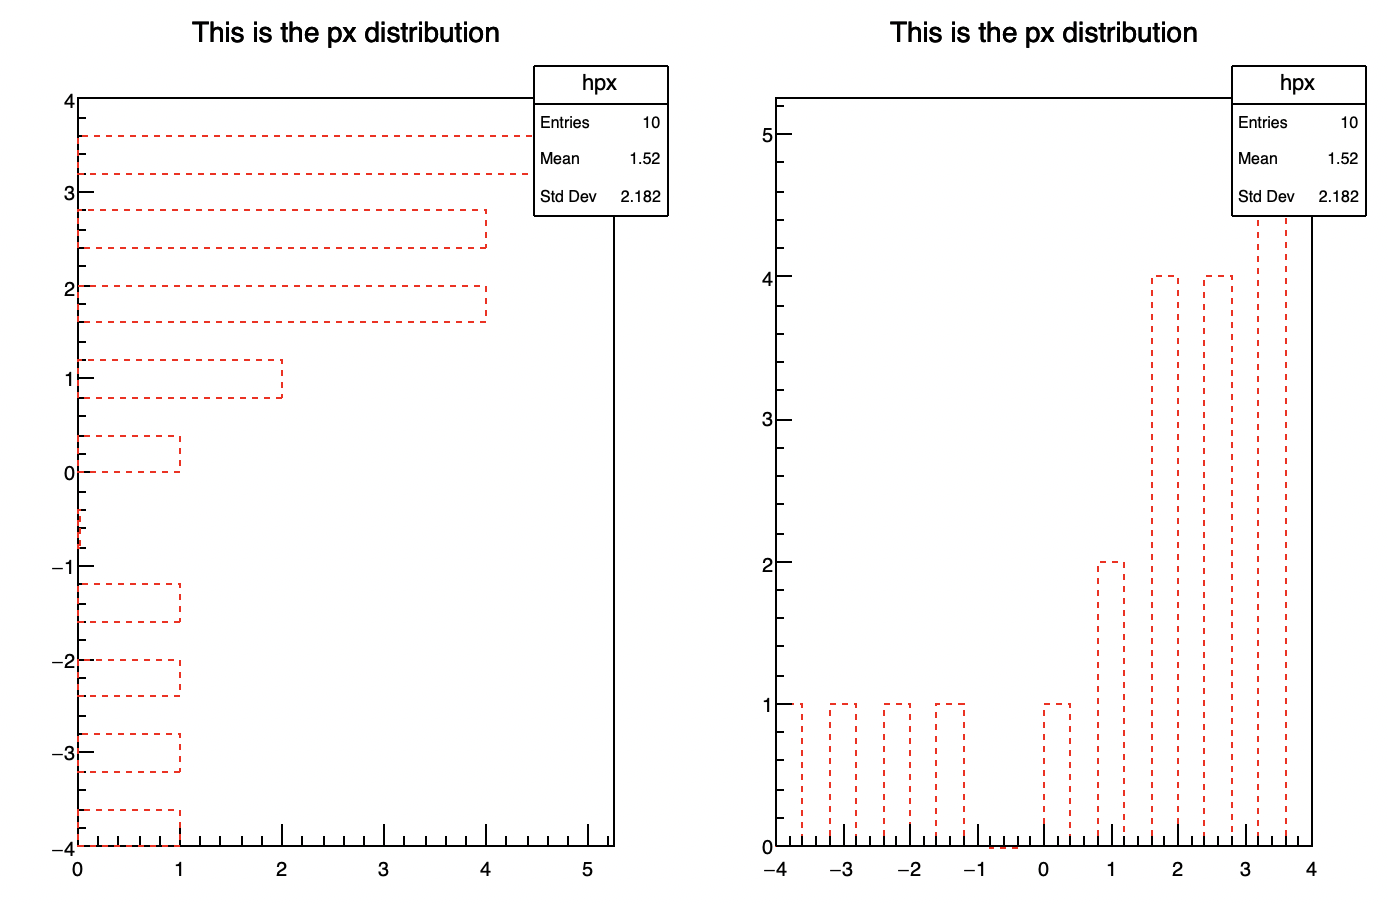
After some googling, I have found the “hbar” option and it is not keeping the dashed line… see the plot2: summaryDisco_onlyHELHC_15_Y.pdf (14.5 KB)
h_27[0].Draw(“hbar”)
h_27[1].Draw(“hbarsame”)
How can I do plot1 in Y-axis?
Bets regards, David.
No it is not doing what I want. I don’t want ot have hbar style in the x axis.
What I want is to keep the style of plot1 and the histograms to be horizontal and not vertical.
So in summary plot1 with a flip of X-Y axis.
The line style has nothing to do with the bar or bar option. In your first plot you every likely have somewhere (in your macro) something like h->SetLineStyle(…).
Yes you are right. I have asked explicitely the style with SetLineStye(2).
What I have seen is that bar or hbar option are making hisotgrams filled by default and destroys the dash-line/not-filled style of my histogram.
My initial question is : how can I have my plot1 with horizontal histograms with this exact same style?
If you want a plot like the bar one you showed tI do not see any other way. May be you can try to show it without dotted line. using transparency for instance ?
or:
TGraph would allow to switch axis more easily than TH1. You can try to put your dotted line in a TGraph.