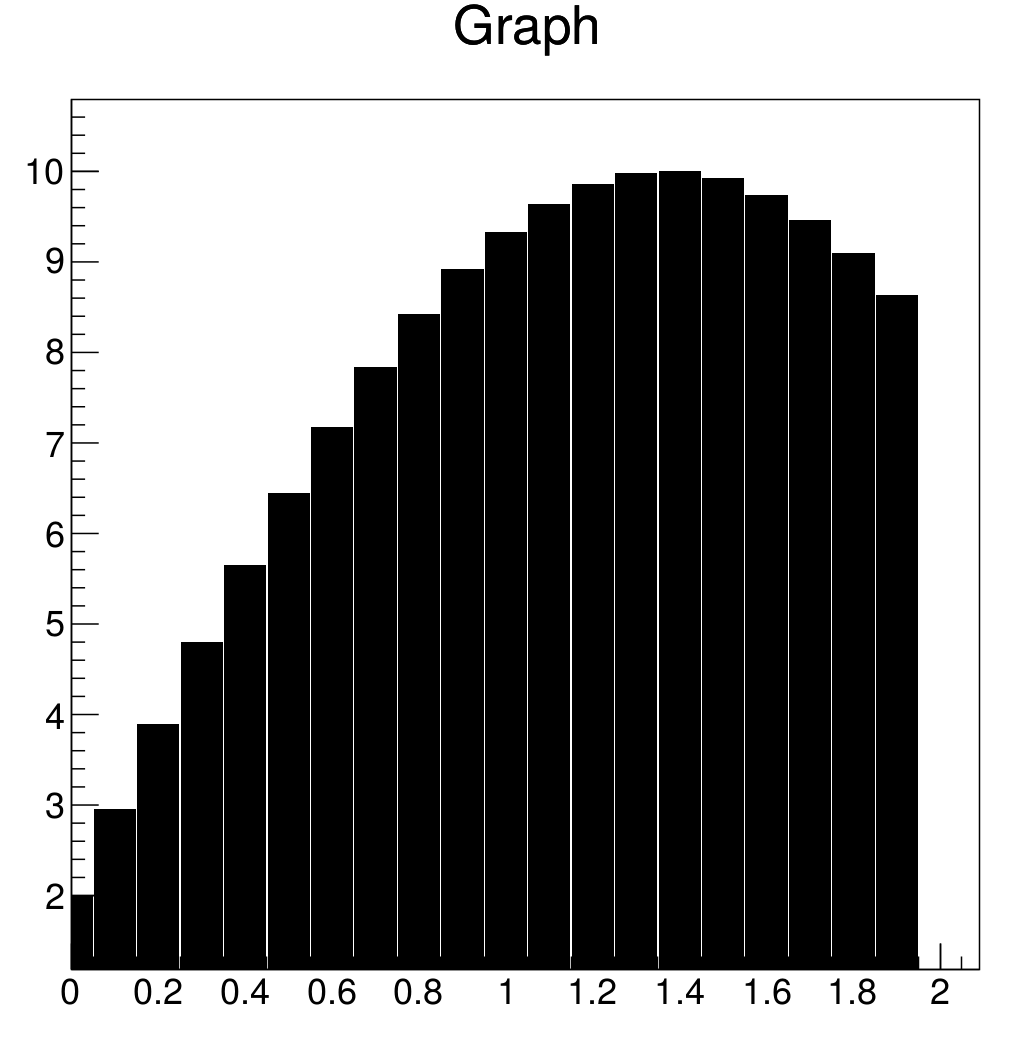
I have been told to use TGraph and I have done this simple example
import ROOT as r
import math
from array import array

n=20
x, y = array( 'd' ), array( 'd' )
for i in range(n):
  x.append(i*0.1)
  y.append(10.*math.sin(x[i]+0.2))
gr1 = r.TGraph(n,x,y)
gr1.Draw("AB")
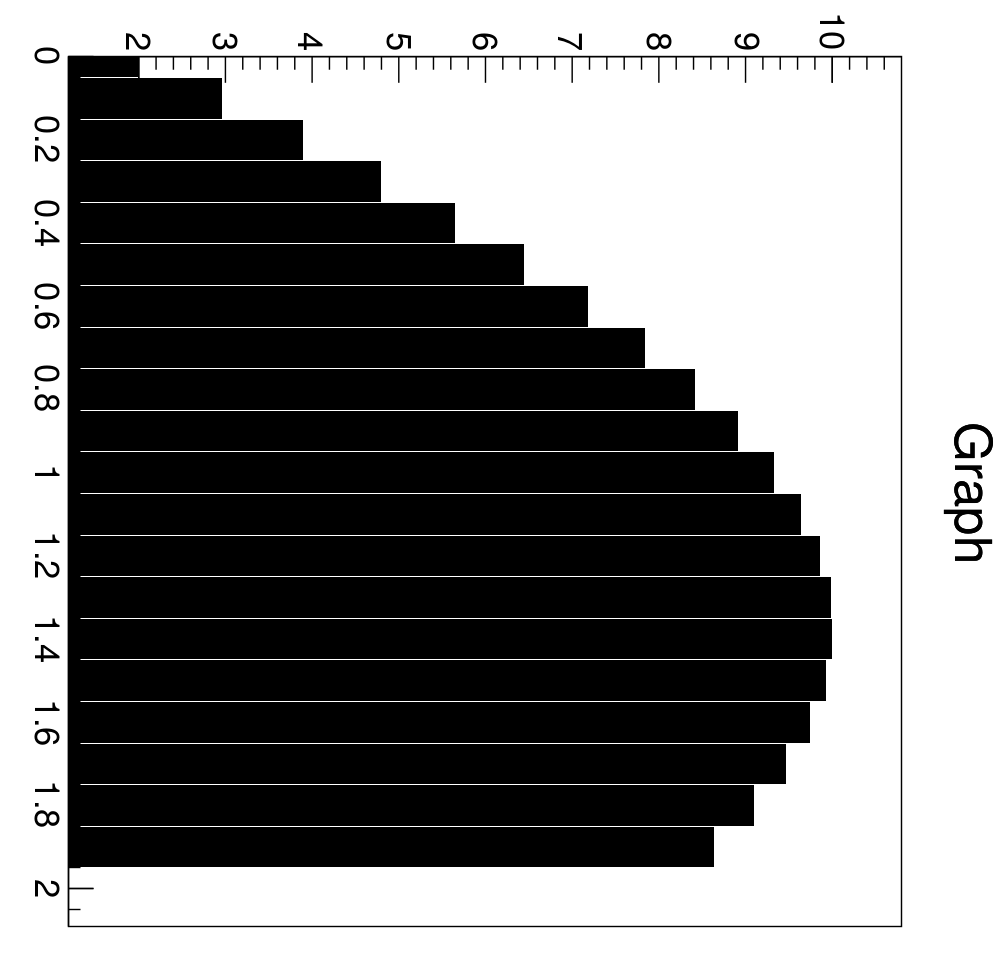
I think the only simple way (referring back to the previous thread) with be to implement the HBAR option with line drawing. They are now implemented only with filled polygon.
I am sorry I don’t understand your point.
In between, I have abandonned my initial plan because I have lost enough time to achieve such simple thing, that seems to not be handled by ROOT.
So I am using SetFillStyle(3365) to replace the dashed-line-empty histograms. It is not beautiful but it works easily.
The line attribute are not supported by the HBAR option right now. Simply ignored. I am looking at that. With the current root you need to find a other solution (like the one you found).