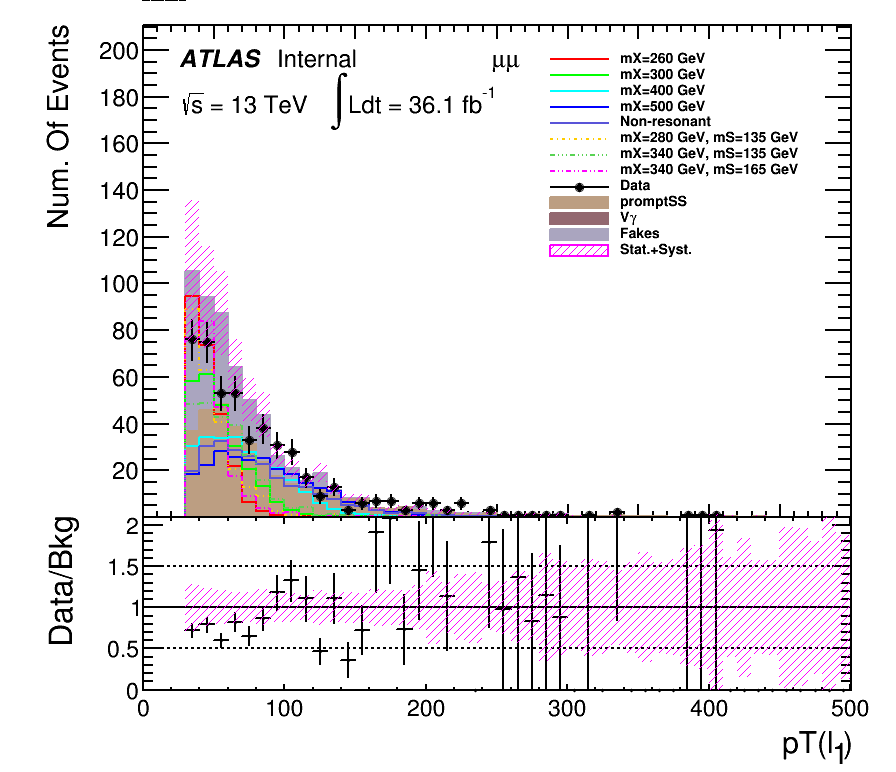
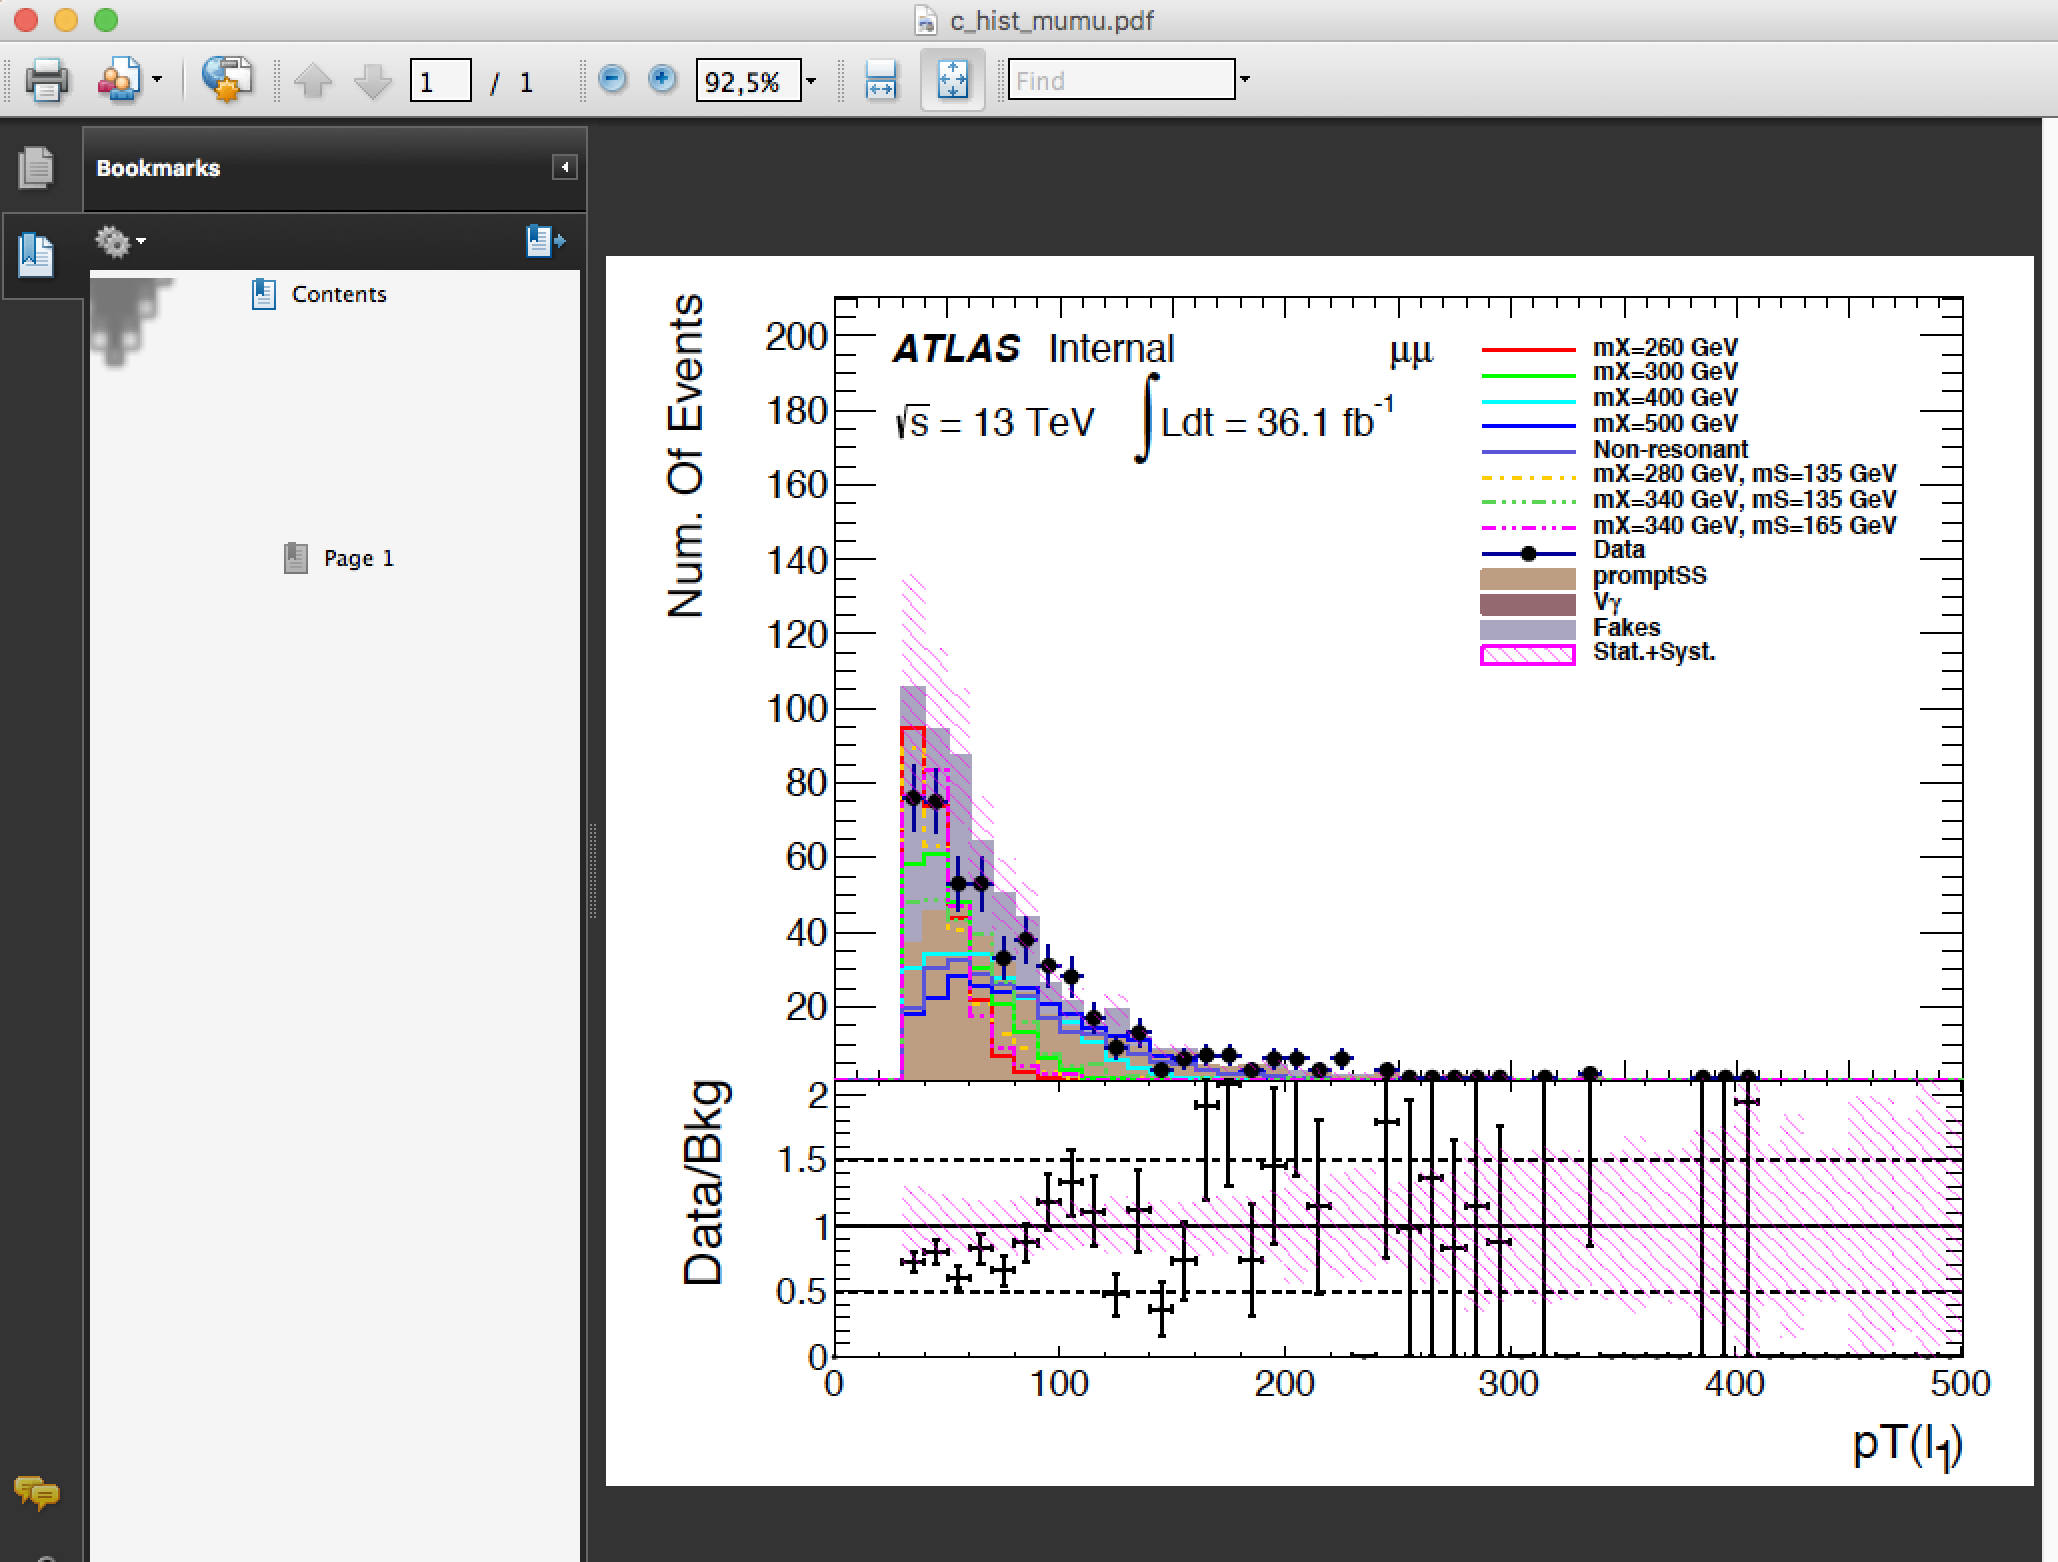
I’m trying to make a plot using TGraphErrors. Please see the attachment. It looks the output plot displays correctly, in preview in Linux and Mac. But there is always problem when displaying via Adobe Reader under Windows7. I don’t know if this is related with the Reader or there is some potential problem in my code…Also if I save it to png file, you will see a short dash line on the top left of the canvas, what’s the reason for this? Thanks. pt_leadinglepton_mumu.C (61.2 KB)
That’s exactly the weird thing, the plots work fine everywhere except in adobe on Windows. I tried to update to the latest version of adobe, but didn’t work. (see same problem if using other’s windows computer)
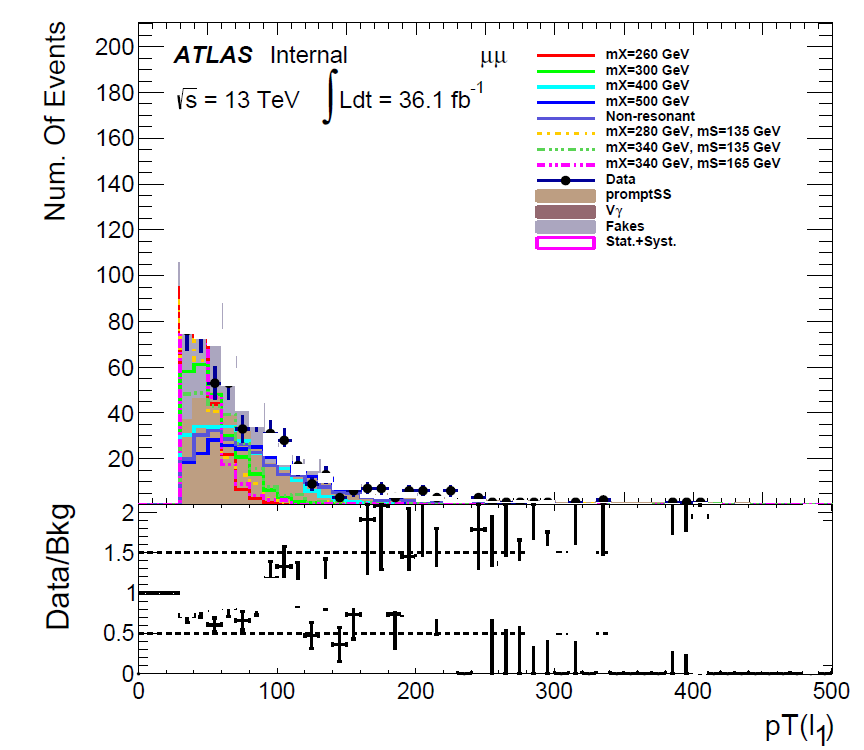
And the other thing is about the ‘dashed line’, it only occurs in png file (on Mac and Windows). I thought this might give some hints.
I really don’t know what’s going wrong there…
Ah, it works for the macro you sent. May I ask why? Thanks.
I see the only change is 3004->3254, but when I change it directly in .cxx, it doesn’t work.
The 1st macro you sent (the one i modified ) is one produced by Print method.
I cannot run the 2nd one you sent… which is the real one …
may be you changed the fill style in the wrong place ? may be you forgot some places ?
I put all the necessary samples here: /afs/cern.ch/user/m/mzhou/work/public/ForCouet
You only need copy this directory and just run: root -l plot_HSS.cxx
Thanks in advance!
$ root -l plot_HSS.cxx
root [0]
Processing plot_HSS.cxx...
In file included from input_line_10:1:
/Users/couet/roottest/mason/plot_HSS.cxx:21:10: fatal error: 'atlasstyle-00-03-05/AtlasStyle.C' file not found
#include "atlasstyle-00-03-05/AtlasStyle.C"
         ^~~~~~~~~~~~~~~~~~~~~~~~~~~~~~~~~~
Thank you very much, but I should have said that maybe you could just investigate the code after line 585, where drawing starts. Please take your time.