2D histograms with "col" option

Dear rooters,
I have an issue when plotting colored 2D histograms.
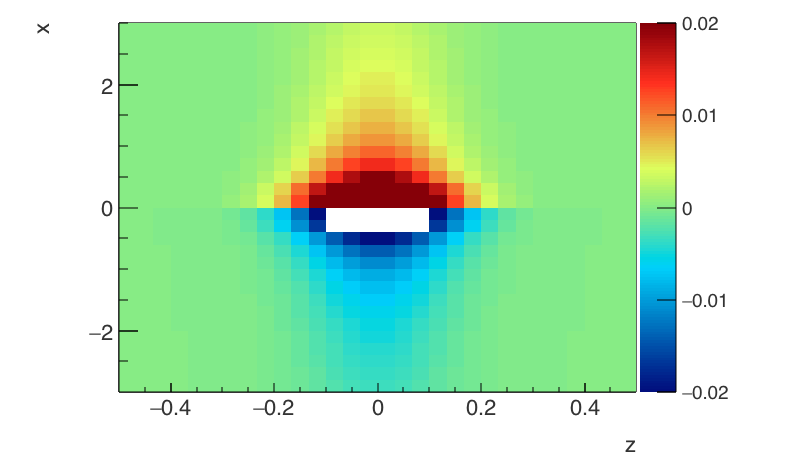
If I cut the plotting range in the z axis (colored dimension), the bins with smaller values than the low z edge are drawn in white.
That does not happen with the bins with greater values than the up z edge, which are drawn using the color corresponding to the up z edge.
This looks horrible in a colored histogram:


Here the little macro reproducing the problem:
testHisto2D.C (872 Bytes)

This issue is destroying the outlook of a plot that I am preparing for a publication:


In the middle panel you can see how the values below the low edge are drawn in white instead of blue.
So any help to fix this is very welcome!
Thanks in advance,
Alberto

In the painting method for the COL option there is an explicit test:

         if (z < zmin) continue;

which does exactly what you see. Removing it will surely cure your problem but I have to see for which reasons it was put there.

Ah great!
I edited THistPainter.cxx in my ROOT installation, commented that line (number 5200 in root 5.34.23)
with

if (z < zmin) continue;

and recompile.
It is working nicely in the example that I gave in the previous post! thanks!


However it has a side effect in the other plot, look:


Now, we do not see these white bins in the middle plot, but then a even uglier gray rectangle appear in the top panel.
Could we setup an option to activate/deactivate this behaviour individually?
Something that we add to the drawing options…
Cheers!

Do you understand where does this grey rectangle comes from ?

Yes, I think so. It is exactly the same behaviour than in the other case.
In the top histograms I cut the z range at certain level.
Then by default root does not paint the bins whose z < zmin.
That is what I want in the top plot, but not in the middle.
That is why I think that an option together to the “col” could do the trick of painting the z< zmin bins or not, depending on the desired effect.
Did I explain myself clearly?

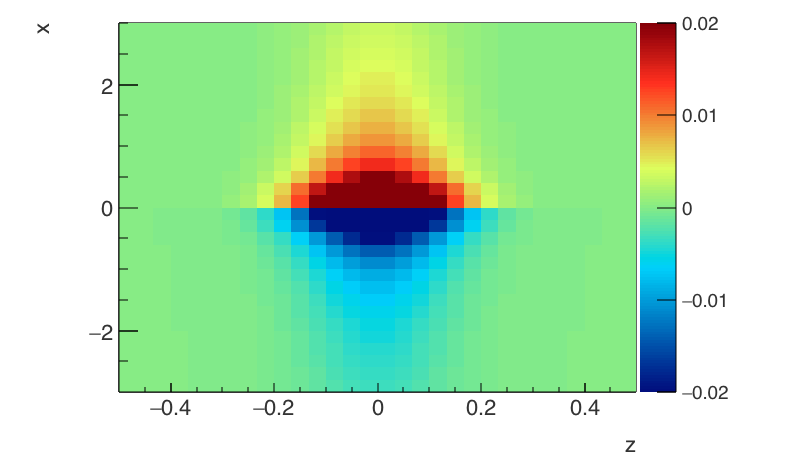
OK, I patched THistPainter.cxx myself to do this.
Now, if I do just Draw(“colz”) the behaviour is the usual: bins with z<zmin are not painted.
But if I do Draw(“colz0”) they are!
Here is the result in my plot:


So I am happy!

Just to let you know I edited the following lines in THistPainter.cxx

l = strstr(chopt,"COLZ"); if (l) { strncpy(l," ",4); if (hdim>1) { Hoption.Color = 2; Hoption.Scat = 0; Hoption.Zscale = 1; if(strstr(chopt,"0")) Hoption.Zero = 1; } else { Hoption.Hist = 1; } } l = strstr(chopt,"COL" ); if (l) { strncpy(l," ", 3); if (hdim>1) { Hoption.Color = 1; Hoption.Scat = 0; if(strstr(chopt,"0")) Hoption.Zero = 1; } else { Hoption.Hist = 1; } }

Which means that the Hoption.Zero flag is set or not depending on the “0” option.

Then I go to the other line that you pointed out and do:

if(!Hoption.Zero) if (z < zmin) continue;
So this condition is evaluated only if the flag is not set.
What do you think?

Yes I think this is the right way. I will check what is the best way. COL0 seems not used:
root.cern.ch/root/htmldoc/THistPainter.html#HP14

COL0 could be: force the painting of bins with 0 content and paint the bin < minimum like the minimum

This option is now implemented in the ROOT master (ROOT 6).

1 Like

root.cern.ch/root/htmldoc/THistPainter.html#HP14