I have plotted a 2D histogram (attached). But I have tried to show the projection on xz and yz plane
respectively in the same attached plot. Please help me to do this.

Thanks
Dipen
Dear Coyote,
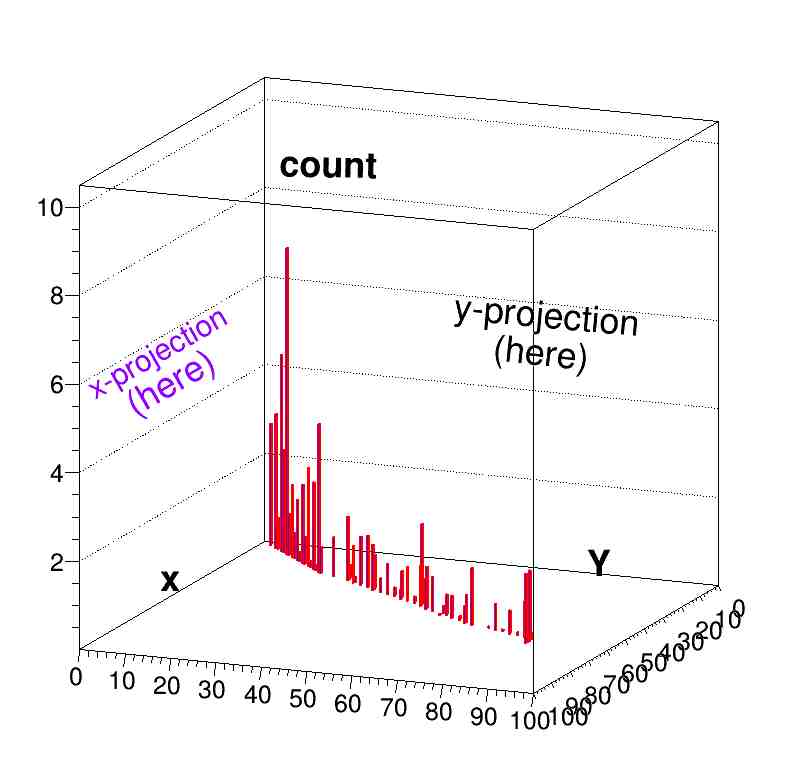
I couldn’t explain to you what I wanted to get. Actulay I don’t want to get the projection of the 2d histogram separately. @couet I want to make a plot where 2D histogram and its x and y projection will be in same plot (attached).
Thanks
Dipen
I don’t think you can do that in ROOT. Check out what you can do with the “surf” options (in particular the surf3 and surf7 examples) of THistPainter
Dear dastudillo,
I have tried using surf but couldn't do that.
Thanks
Dipen
There no existing option to do that simply. Of course with a bit of code it can be done. A bit like this example where a 3D line is added on the 3D plot.
Dear couet,
I have tried using your given link, But I could not do.
Thanks
Dipen
Can you post what you have done ?