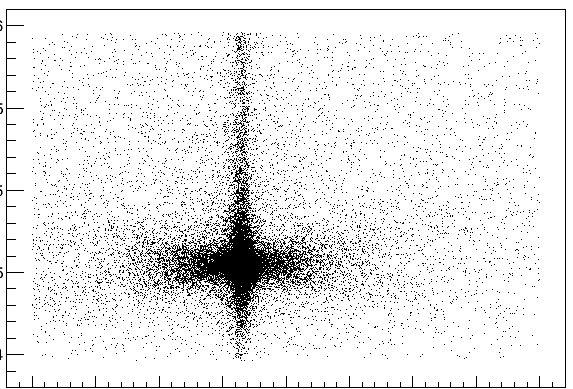
I have two branches(say D_0 and D_S) in my root file. I have plotted individually the two variables. I have plotted two variables one along x-axis and another along y-axis. Now I want to fit it. Can anybody please provide me the macro for fitting the attached plot.
Once you have drawn the two branches you have a 2D histogram called htemp or you have defined yourself the 2D histogram. In any case a 2D histogram is available. The following example shows how to fit 2D histograms: https://root.cern/doc/master/fit2dHist_8C.html