I have a TGraph that spans at Y values, for example, from 0 to 10. It has features on level of 1, but also on level of 0.01. The problem is, that when I draw the whole graph, I cannot zoom below, let’s say, 0.1. To see the small features, I have to draw only the part of TGraph with small values. However, I often would like to see “big” features and be able to zoom to see “small” features. Is there a way to extend the TGraph zooming capabilities?
A peak spanning from, let’s say, 1.0 to 5.0 on Y scale
After zooming, other peak spanning from 0.01 to 0.02 on Y scale
So I want to be able to see the second peak only after zooming (it is too small to be seen in linear scale when I see the first, large peak), but the TGraph prevents me from zooming that much.
Ohh, I think you are encountering a problem between the Keyboard and Chair
This of course assuming that you are zooming in by hand.
I believe you are trying to zoom in to 0 - 1, right away. ROOT has a problem with that, it cannot do single zooms that are very small (high zoom). Instead make a larger zoom of 0-2, and then another zoom from 0-0.5.
Or right click on the axis and select SetUserRange, and set 0 to 1 or whatever.
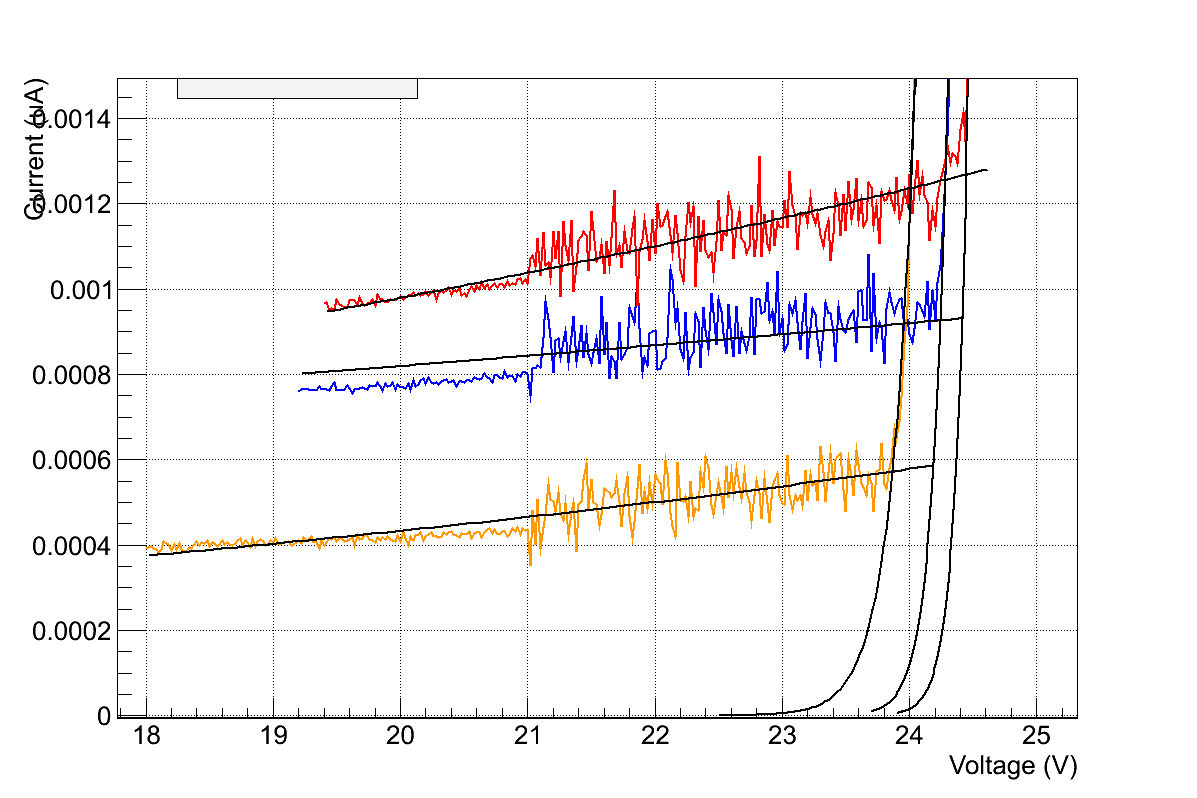
I take IV curves, where the current is measured down to 0.0005uA, and highest is plotted at around 80uA, and I can zoom in just fine on a linear scale, though I do need to zoom, like 5-8 times because 0.001 is so small.
Thanks, you have pointed me in the direction where the error is.
So when I draw the TGraph from TTree, I cannot zoom to small values. When I save the TGraph to a separate file, then open it and draw, I can zoom without a problem.
So… Is there any way to force the TGraph drawn from TTree to behave as a standard TGraph?
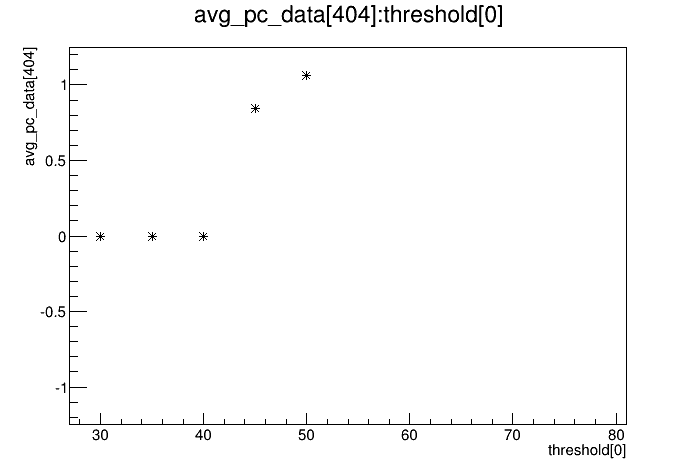
To SetRangeUser from 0 to 0.002, and the same on Graph from graph.root. In the case of TTree it shows range from 0 to about 1.2, does not want to zoom in further. graph.root (4.38 KB) calibration_1.root (105 KB)