[Z (bad) label for palette axis in TH3D

Continuing the discussion from Z (bad) label for palette axis in TH3D:

Dear Mr. Couet,

Could you please let me know how this was fixed/patched? I am using root 6.26/06 and get the same issue with a TH3D. The palette axis label is the same as the z axis.
Thanks in advance!


ROOT Version: 6.26/06
Platform: OSX 12.6


Sorry, I do not remember. That’s an old think. Can you provide a small example showing the problem you encounter?

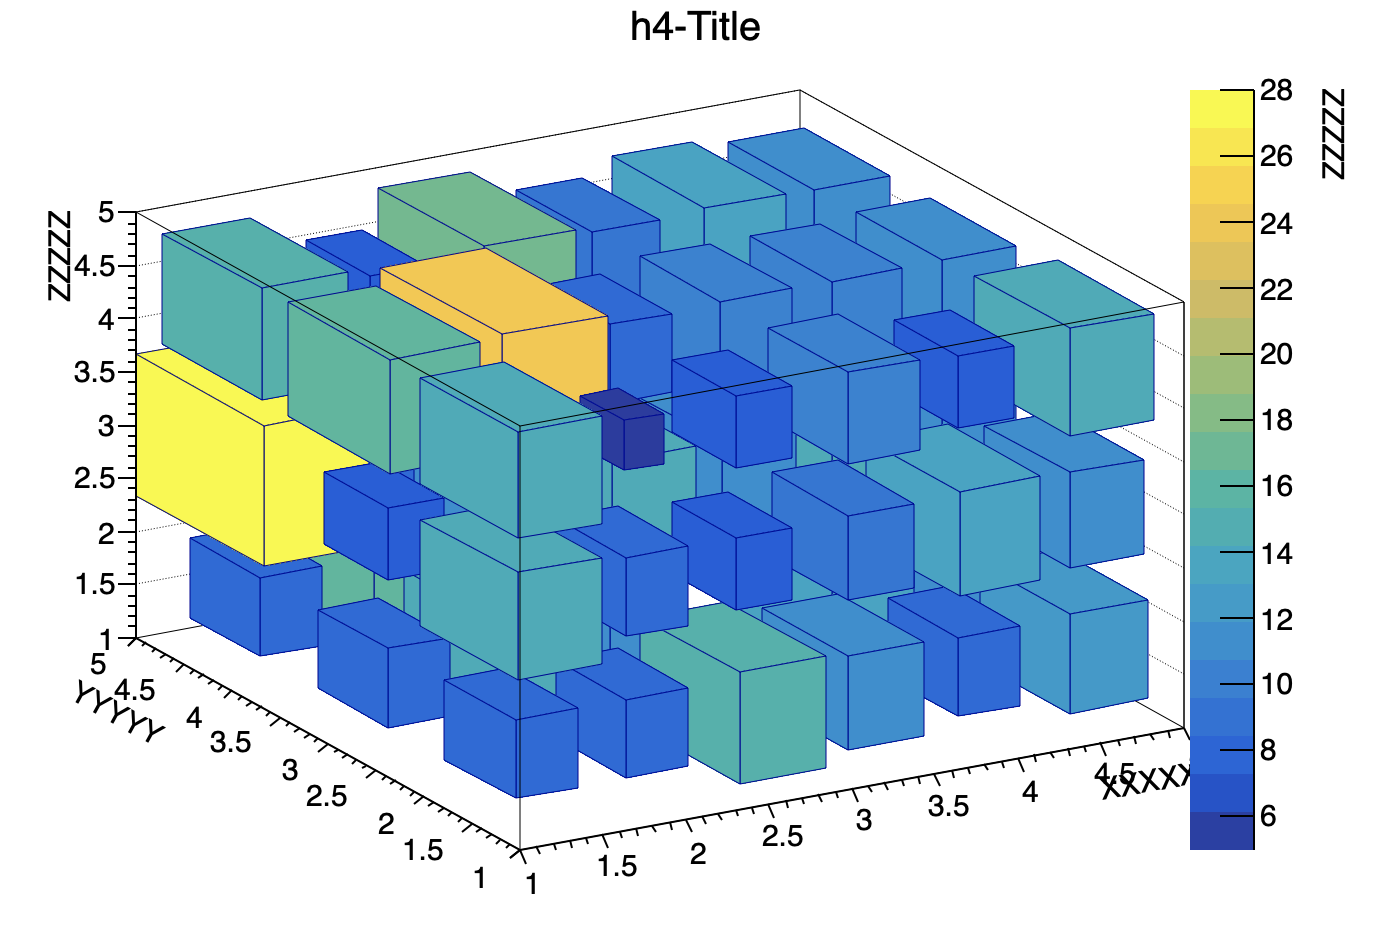
Hi, the problem is that the zcol showing the palette appears with the same title as the z-axis of a 3D histogram. This is not correct since the color code corresponds to the bin content. See below the plot I generated with my (very long) macro.

Thanks in advance!

Reproducer:

void testTH3Title() {
   auto C = new TCanvas();
   C->SetRightMargin(0.15);
   TRandom3 r;
   int nBins = 3;
   int nEvents = 1000;
   double minRange = 1; double maxRange = 5;
   TH3D* h4 = new TH3D("h4", "h4-Title",
                       2*nBins, minRange, maxRange,
                       nBins , minRange, maxRange,
                       nBins , minRange, maxRange);

   for ( Int_t e = 0; e < nEvents; ++e ) {
      Double_t x = r.Uniform(0.9 * minRange, 1.1 * maxRange);
      Double_t y = r.Uniform(0.9 * minRange, 1.1 * maxRange);
      Double_t z = r.Uniform(0.9 * minRange, 1.1 * maxRange);
      h4->Fill(x, y, z, 1.0);
   }
   h4->Draw("box2 z");
   h4->SetTitle("h4-Title;XXXXX;YYYYY;ZZZZZ");
}

I agree, the Z title should not de displayed along the palette.

This PR fixes this issue:

Thanks to have seen it.

@couet Maybe you could implement:
h4->SetTitle("h4-Title;XXXXX;YYYYY;ZZZZZ;TTTTT");

Yes that’s also an option. The fix I did makes it at least coherent for the axis with have now. @moneta what about a such new T axis ?

Thank you very much.
Are you planning to add this fix to the next ROOT release?

the T Axis? I am not sure, I would prefer that @moneta gives his point of view.
The fix is in the master now. The palette has no title in the case of TH3.

Hi,
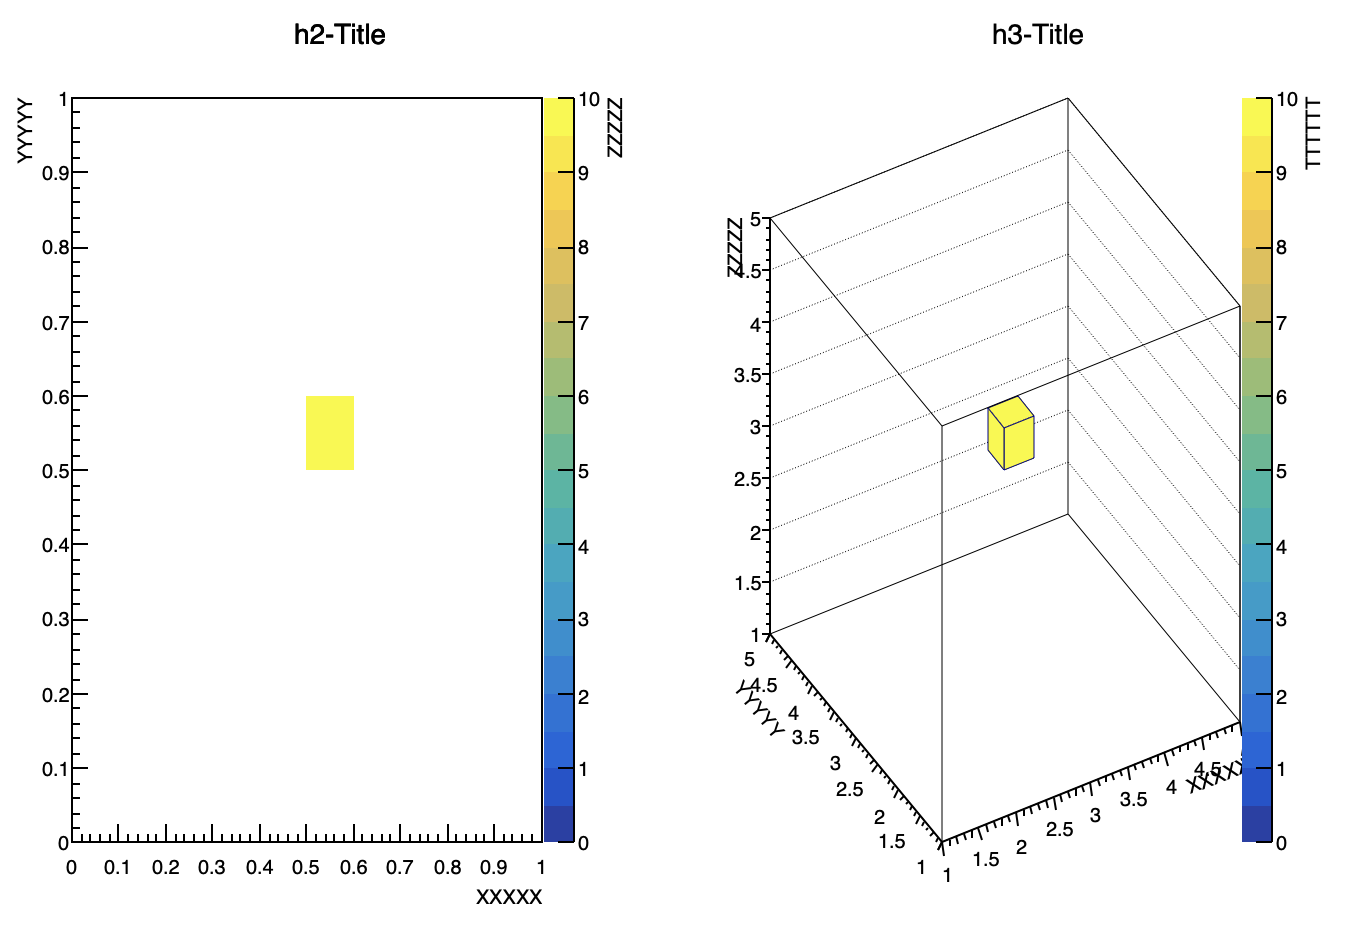
I agree to have a function for TH3 like h4->SetTitle("h4-Title;XXXXX;YYYYY;ZZZZZ;TTTTT");, but I would not like having another axis stored inside the histogram class. We should think about a solution for setting correctly the palette axis of a multi-dim histogram

Lorenzo

Hi, I just installed the new ROOT release (6.28/00) on my Mac (OSX 12.6) and the problem is still there. Do you have a hint when the fix will be released?
Thanks in advance.

I applied the fix in the master version only.

This topic was automatically closed 14 days after the last reply. New replies are no longer allowed.

Well, it’s an old thread, but … I’ve accidentally faced this problem again.
So, has anything changed in the meantime?
Is there now any possibility to define the title of the “T-axis” (palette’s title) for the TH3?

1 Like

I have done something:

void testTH3Title() {
   gStyle->SetOptStat(0);
   auto C = new TCanvas();
   C->Divide(2,1);

   C->cd(1)->SetRightMargin(0.2);
   auto h2 = new TH2F("h2","h2",10,0.,1.,10,0.,1.);
   h2->SetTitle("h2-Title;XXXXX;YYYYY;ZZZZZ;TTTTTT");
   h2->Fill(0.5, 0.5,10.);
   h2->Draw("COLZ");

   C->cd(2)->SetRightMargin(0.2);
   auto h3 = new TH3D("h3", "h3",10, 1., 5.,10 , 1., 5.,10 , 1., 5.);
   h3->Fill(3, 3, 3, 10.);
   h3->Draw("box2 z");
   h3->SetTitle("h3-Title;XXXXX;YYYYY;ZZZZZ;TTTTTT");
}

I’ll make a PR

PR here. (merged)