Please read tips for efficient and successful posting and posting code
ROOT Version: 6.14/04
Platform: linuxx8664 (Ubuntu 16.04.12)
Compiler: gcc 5.4.0
Hi,
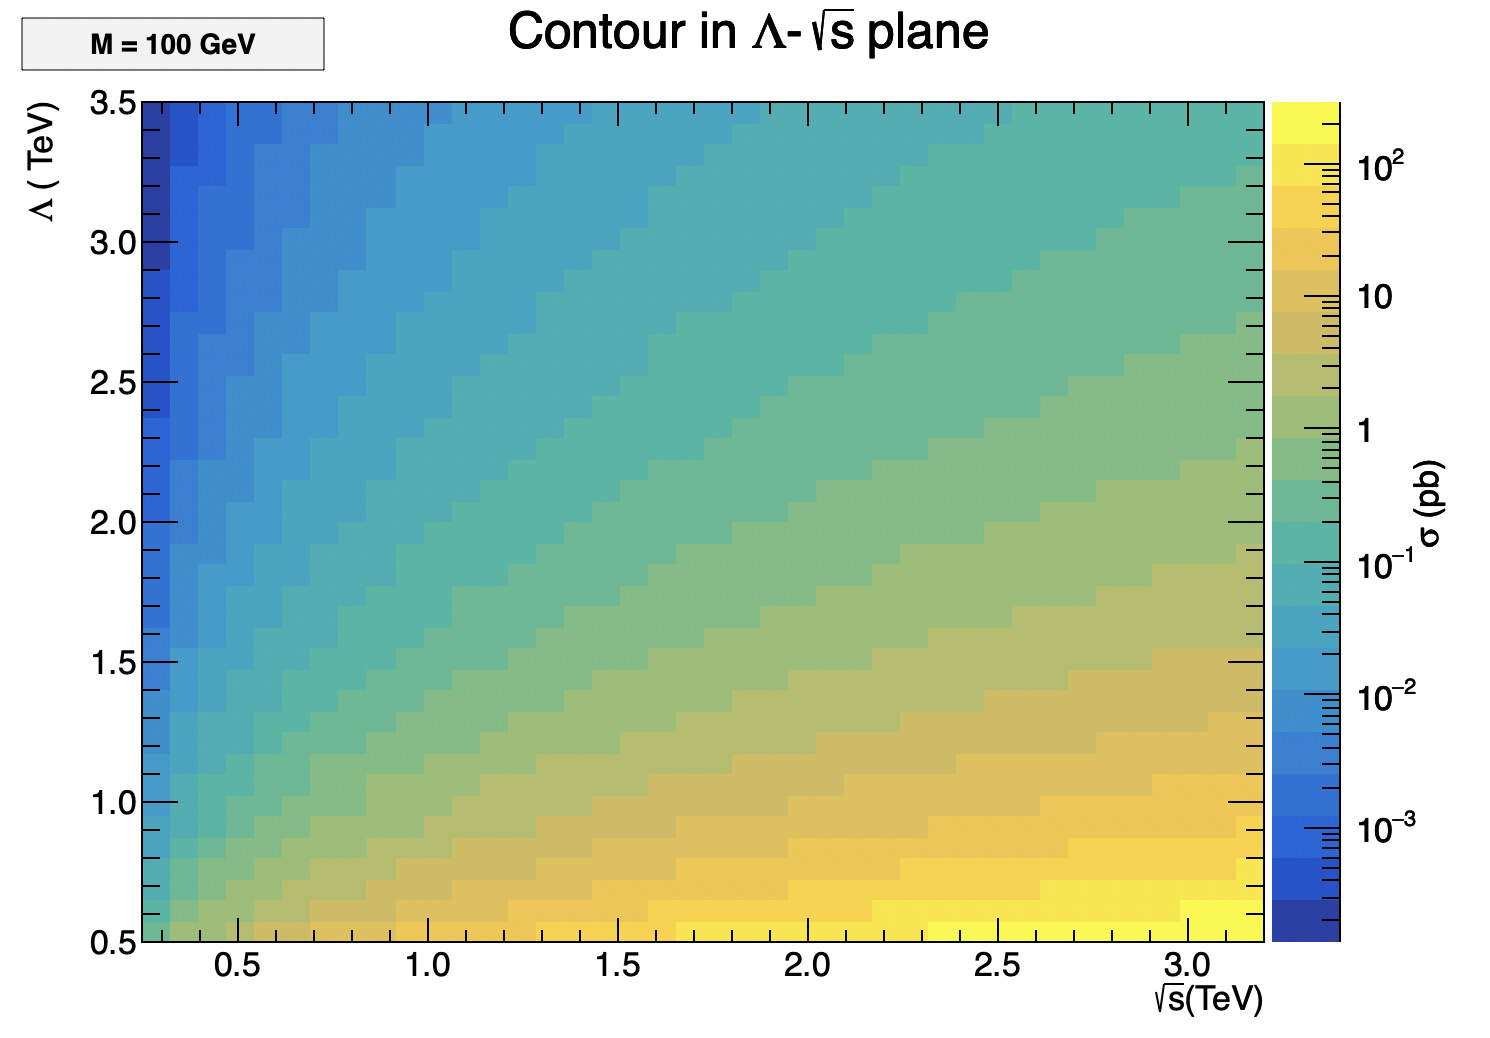
I made a 2D graph with data from a text file. The graph is coming fine. But the Z-axis label is cutting-off the canvass. I tried with different right-margin. It’s the same. And with different offsets it’s coming on top the scale markers and hence cannot be read. So is it possible anyhow that it appears as it is for Y-axis?
And another query is there. If I want to mark the region with some fixed value of the Z-axis, is it possible to do?
I have attached a maco and a sample data file.
TestContour.C (1.1 KB)
Data.txt (8.5 KB)
Regards,
Saumyen