Hi All,
I have a TTree with a branch that is a vector of structs, where the struct contains an XYZVector (GenVector). If I open a TFile with that TTree
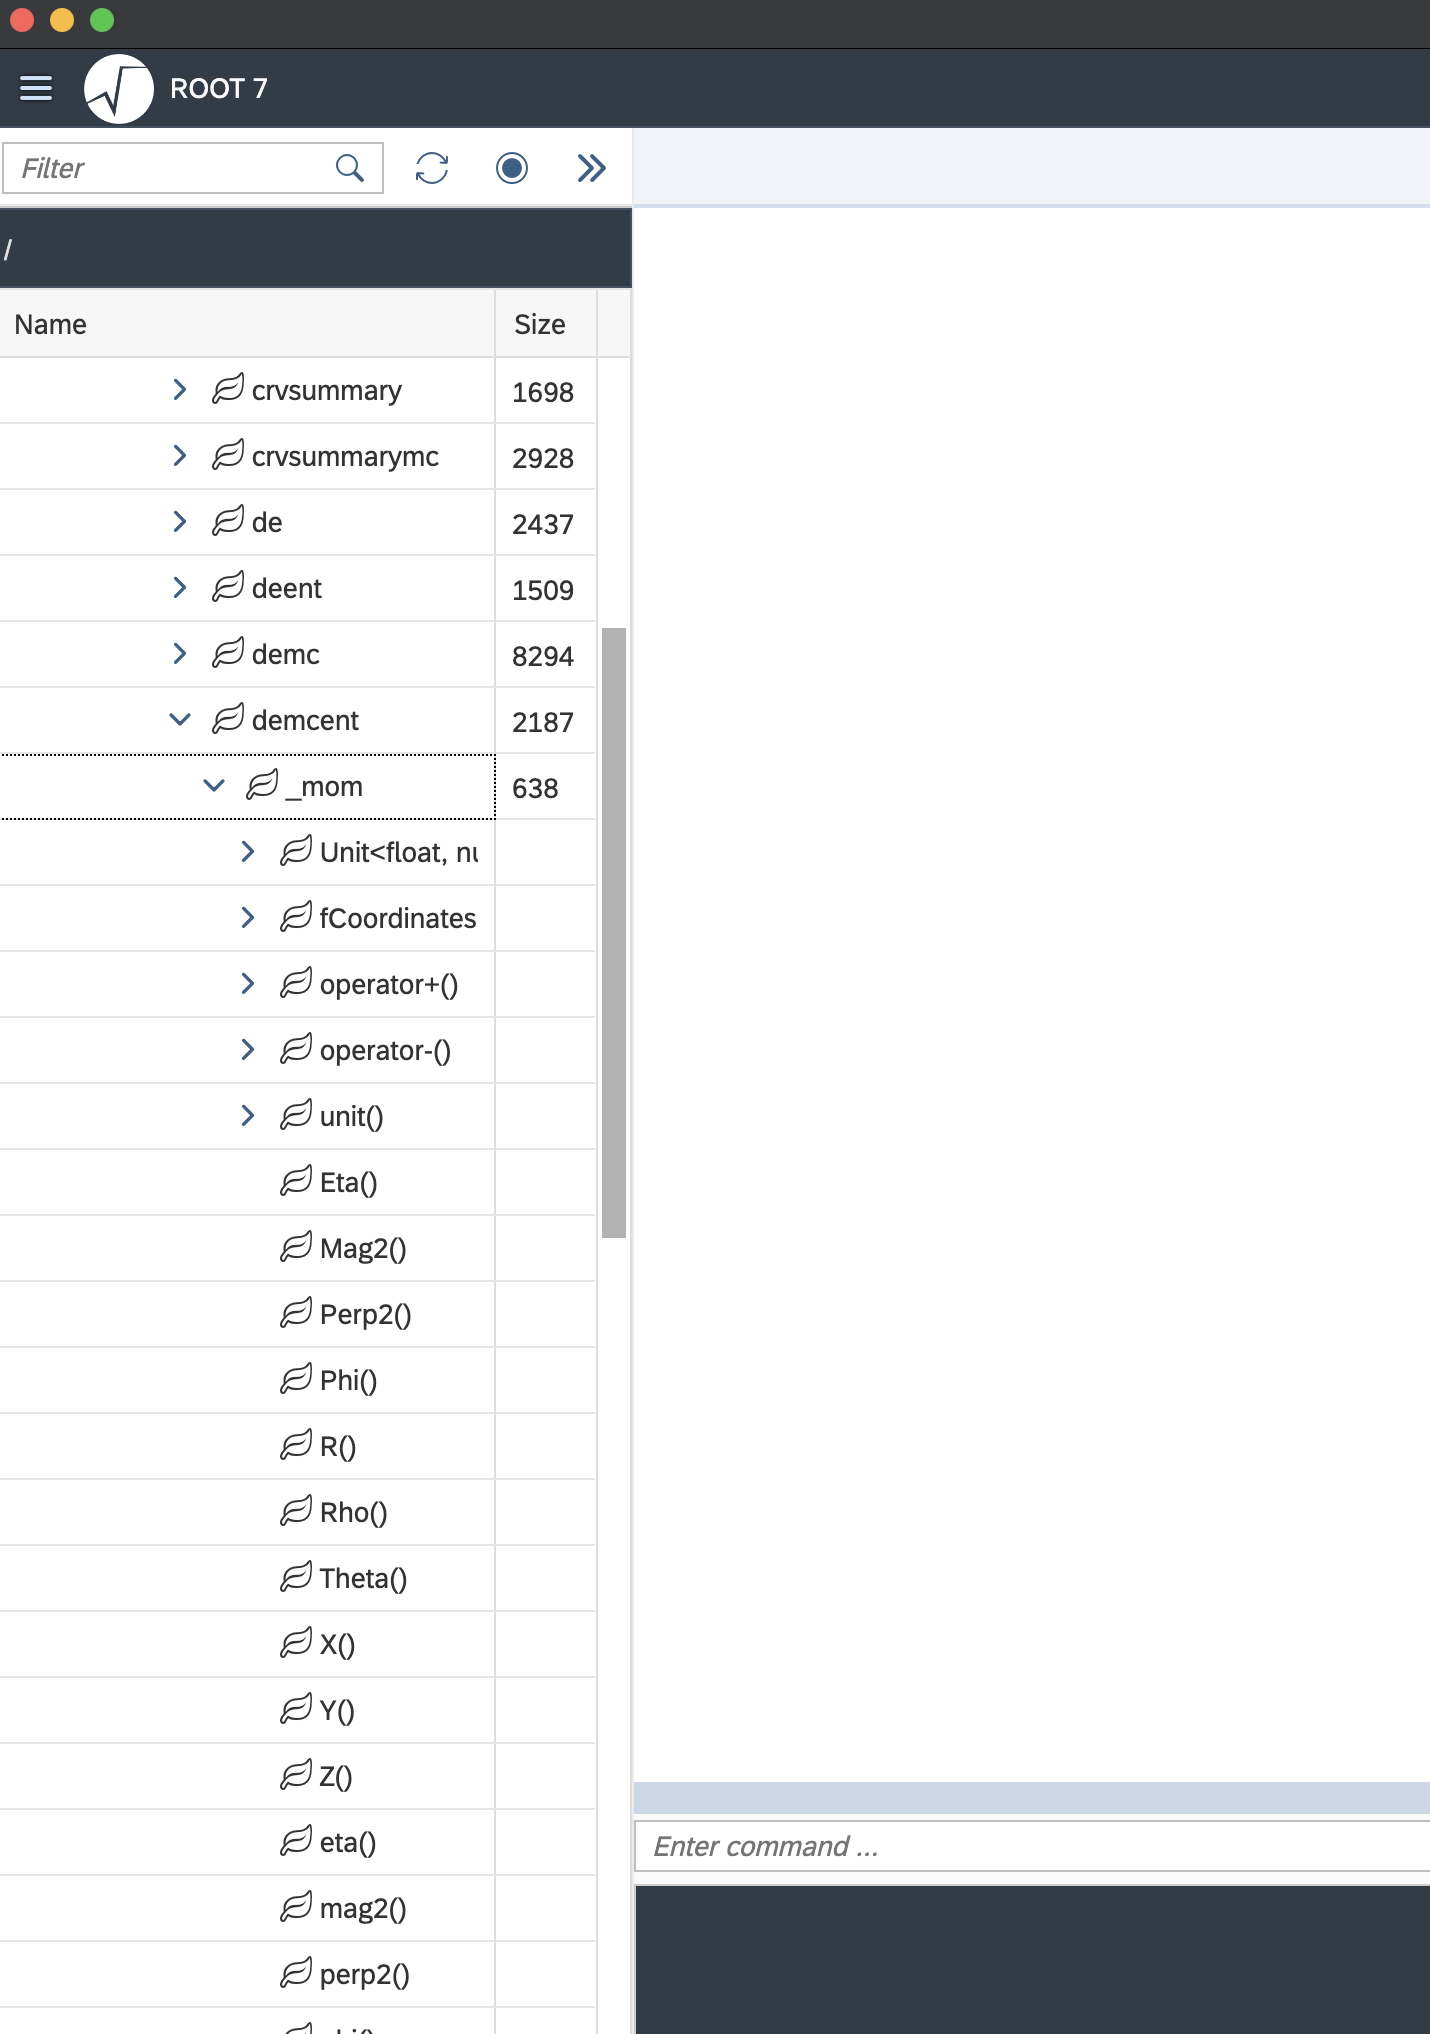
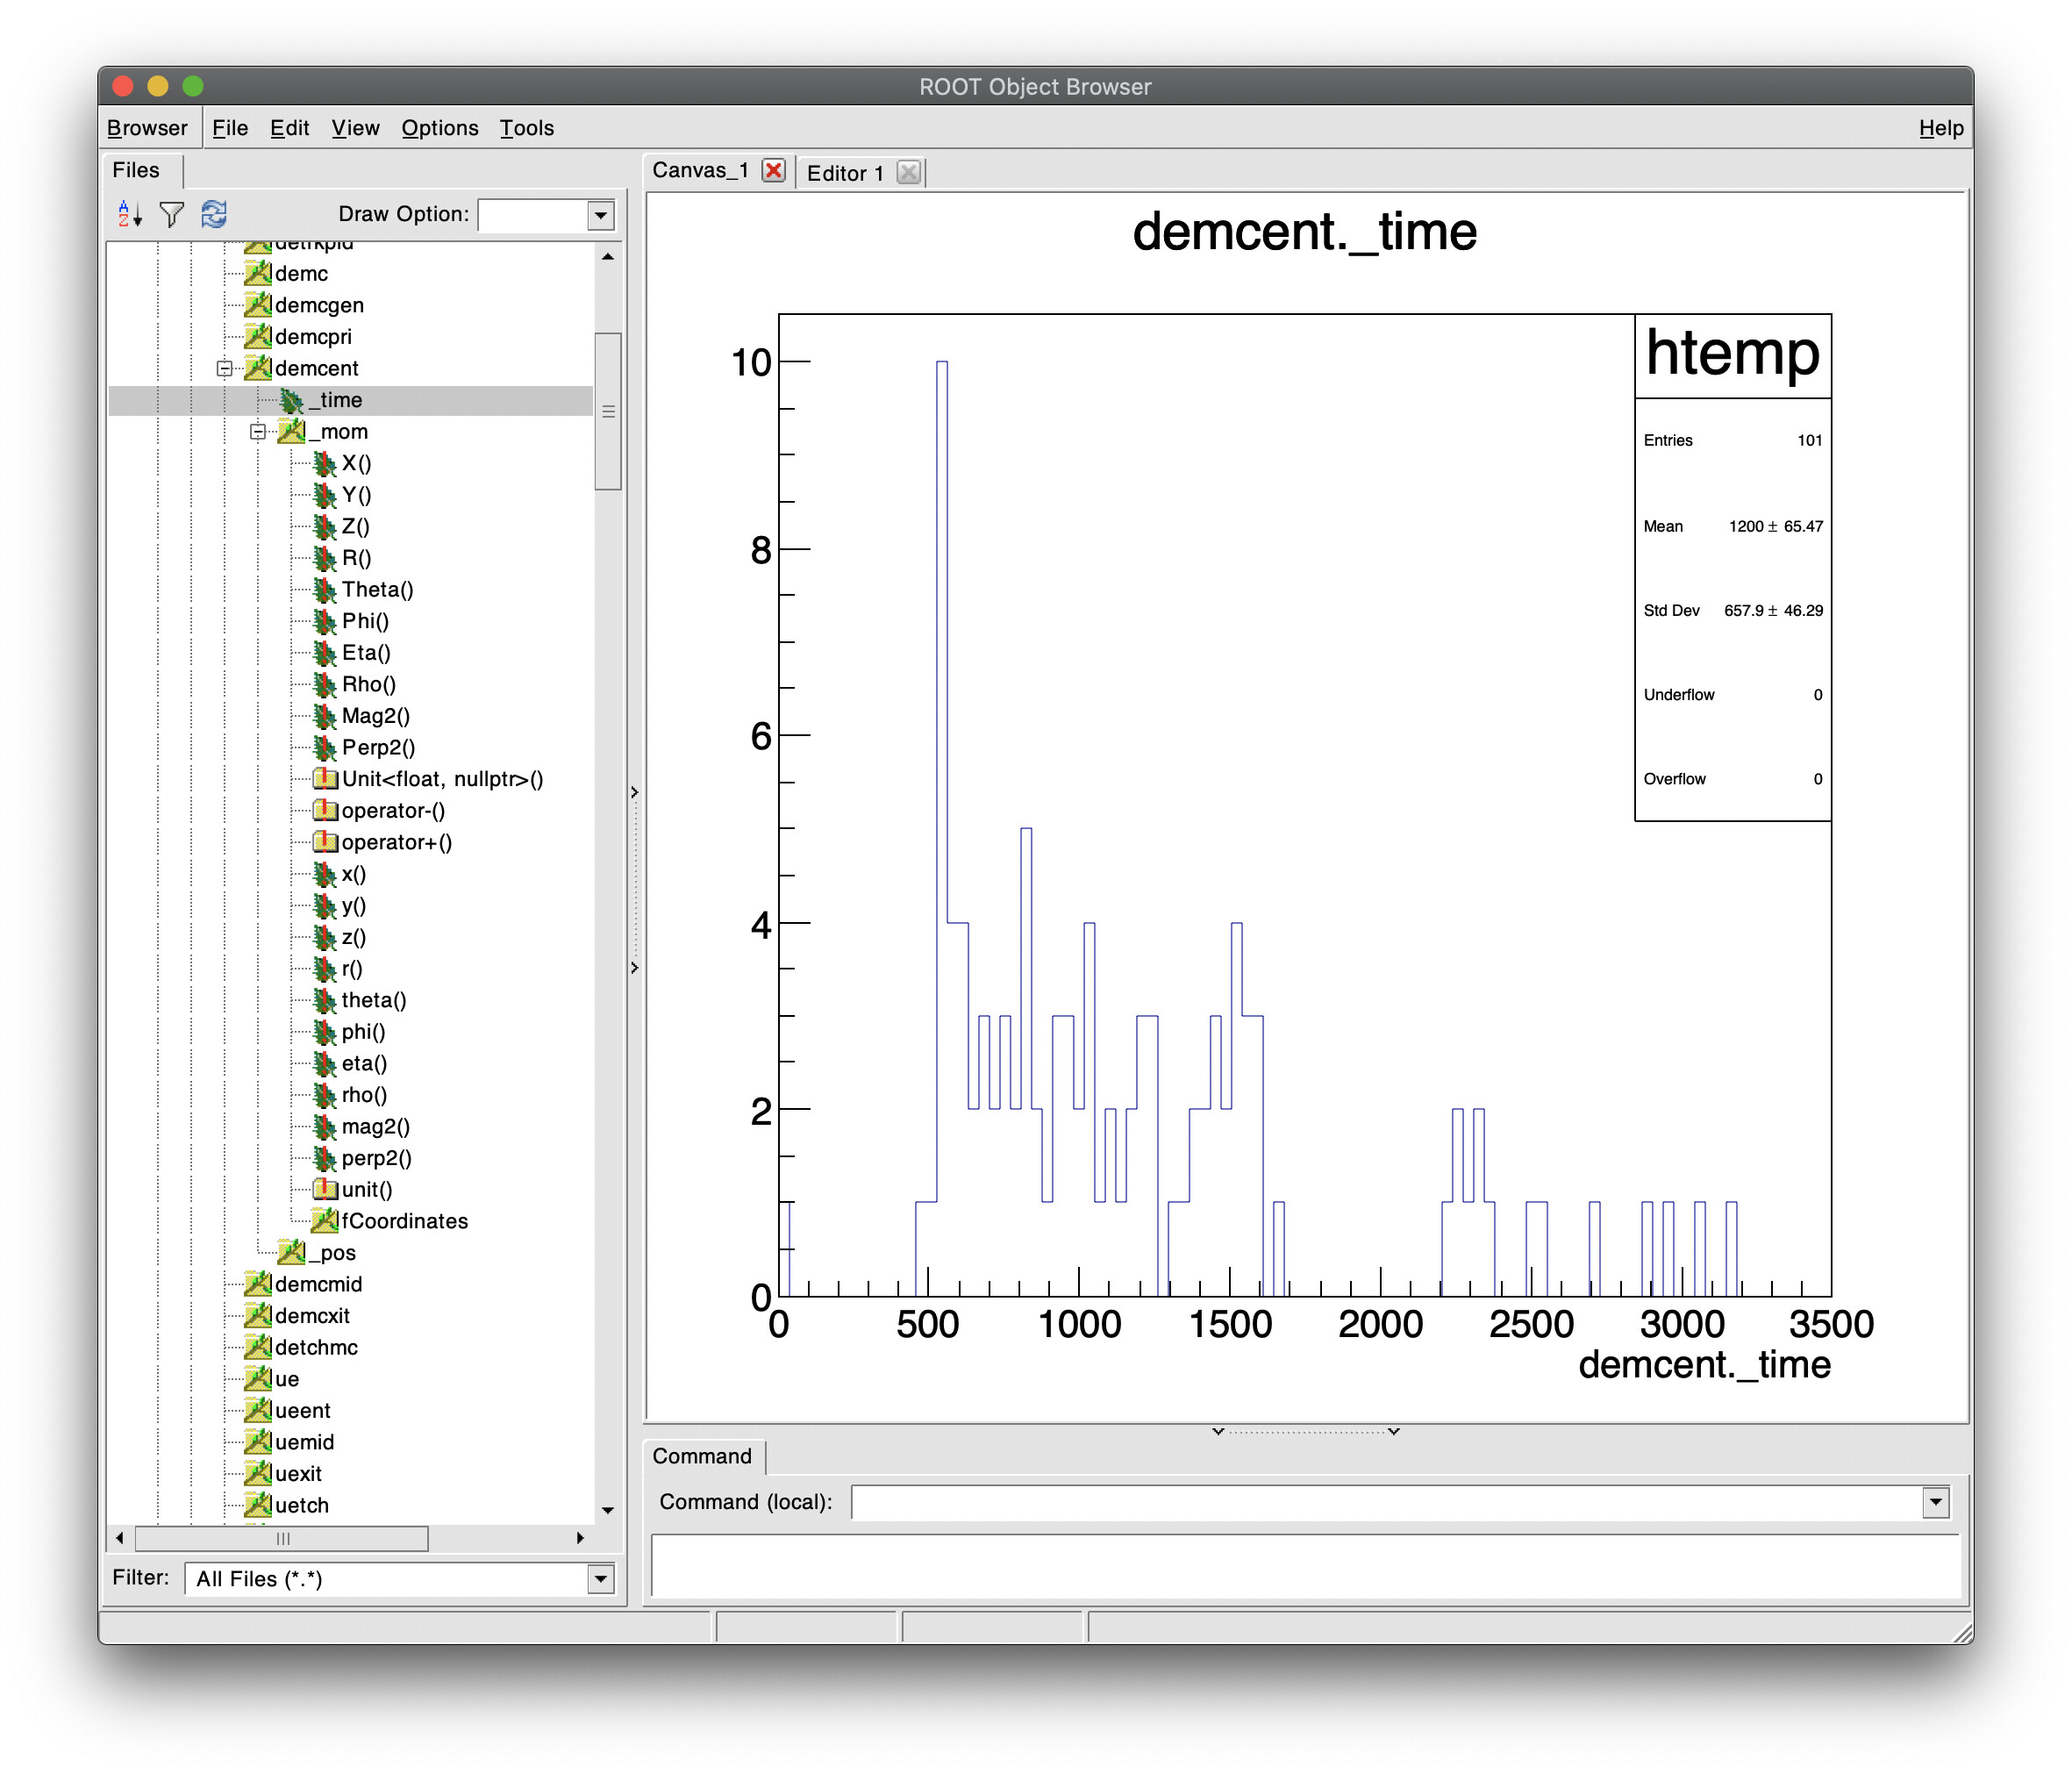
using TBrowser and navigate down to that leaf, its member functions are listed but are unplotable (have a red slash through them):
However, if I run root interactively I can plot that leafs member functions:
ie
root [1] n = (TTree*)TrkAnaNeg->Get(“trkana”)
(TTree *) @0x7ffee3ea26d0
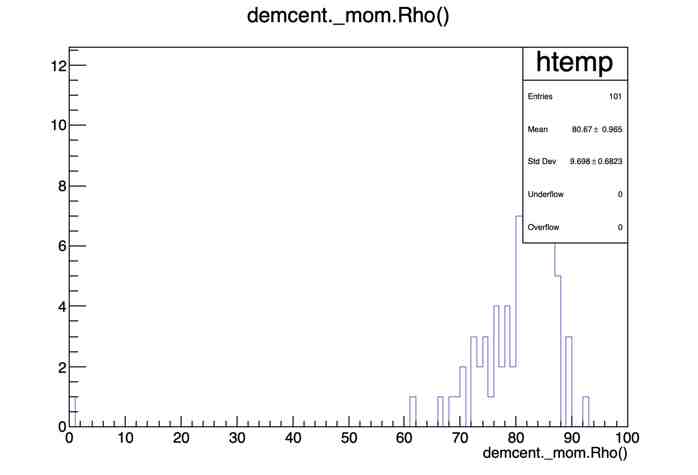
root [2] n->Draw(“demcent._mom.Rho()”); produces
Does anyone know how to configure TBrowser so it can plot those leafs?
_ROOT Version:v6.24/06
_Platform:macos
_Compiler:clang