Wrong output of inverse fit parameter in RDataFrame column

Hi everybody,

Here is the reproducible:

import ROOT
import sys
ROOT.gInterpreter.Declare('''
#include "Math/Point3D.h"
#include "Math/Vector3D.h"
#include <random>
using namespace ROOT::Math;
using namespace ROOT::VecOps;
using std::cout, std::endl, std::stringstream, std::vector, std::string, std::runtime_error;

#define SPEED_OF_LIGHT 299.792458

RVec <double> dToImpact(const RVec<XYZVector>& hits, const XYZVector& rImpact){
    auto getDistance = [&](const XYZVector& hit) { return (hit - rImpact).R(); };
    return Map(hits, getDistance);
}

RVec <double> dToLine(const RVec <XYZVector>& hits, const XYZVector& vtx, const XYZVector& p){
    RVec <double> distance;
    for (const auto& hit:hits){
        double d = (hit - vtx).Cross(p.Unit()).R();
        distance.push_back(d);
    }
    return distance;
}

RVec <bool> selectHits(const RVec<double>& dToLine, const RVec<int>& layer_hit, bool only_closest=true, int n_layers=10, double cyl_cut=9999.){
    int nHits = dToLine.size();
    RVec <bool> selected(nHits);

    if(!only_closest){
        for (int i=0; i < nHits; ++i)
            if (dToLine[i] < cyl_cut && layer_hit[i] < n_layers)
                selected[i] = true;
        return selected;
    }

    for (int layer=0; layer<n_layers; ++layer){
        map<int, double> layer_hits;
        for (int i=0; i < nHits; ++i)
            if(dToLine[i] < cyl_cut && layer_hit[i] == layer)
                layer_hits[i] = dToLine[i];

        int min_idx =(*min_element(layer_hits.begin(), layer_hits.end(),
                        [](const auto& l, const auto& r) { return l.second < r.second; }) ).first ;
        selected[min_idx] = true;
    }
    return selected;
}

double fitFunc(const RVec <double>& x, const RVec<double>& y, const int par=0){
    if(x.size() <= 1) return 0.;

    TGraphErrors gr(x.size(), &x[0], &y[0]);
    TF1* fit = new TF1("fit", "pol1");
    gr.Fit(fit);
    fit = gr.GetFunction("fit");
    if (par == 3) return 1./fit->GetParameter(1);
    return fit->GetParameter(par);
}

''')

ch = ROOT.TChain("test")

# # 2f_Z_hadronic data
ch.Add("./test.root")

df = ROOT.RDataFrame(ch)

df = df.Filter("nECALHits > 0 && abs(xyzCluster.Z()) < 2200.")
df = df.Define("dToImpact", "dToImpact(xyzECALHit, xyzTrackAtCalo)")\
       .Define("dToLine", "dToLine(xyzECALHit, xyzTrackAtCalo, pTrackAtCalo)")\
       .Define("sel_frank", "selectHits(dToLine, layerECALHit, true, 10, 9999.)")\
       .Define("tof0", "fitFunc(dToImpact[sel_frank], tECALHit[sel_frank], 0)")\
       .Define("tof0_inv", "1./fitFunc(dToImpact[sel_frank], tECALHit[sel_frank], 0)")\
       .Define("slope0", "fitFunc(dToImpact[sel_frank], tECALHit[sel_frank], 1)")\
       .Define("slope_inv", "1./fitFunc(dToImpact[sel_frank], tECALHit[sel_frank], 1)")\
       .Define("slope_inv_expected", "fitFunc(dToImpact[sel_frank], tECALHit[sel_frank], 3)")

df.Snapshot("new_tree", "./new_test.root", ["tof0", "tof0_inv", "slope0", "slope_inv", "slope_inv_expected"])

Here is the root file:
test.root (104.6 KB)
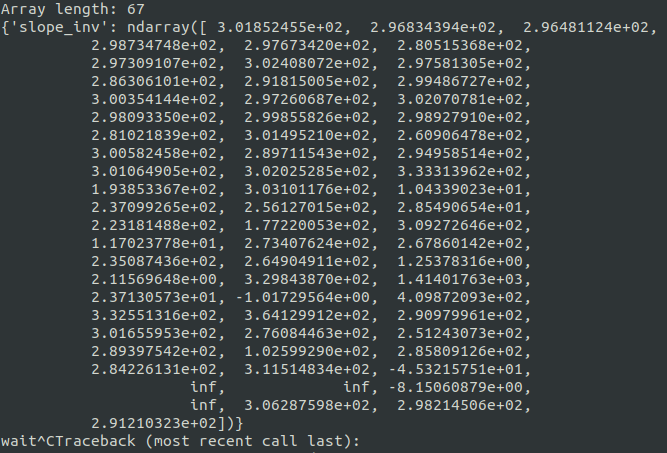
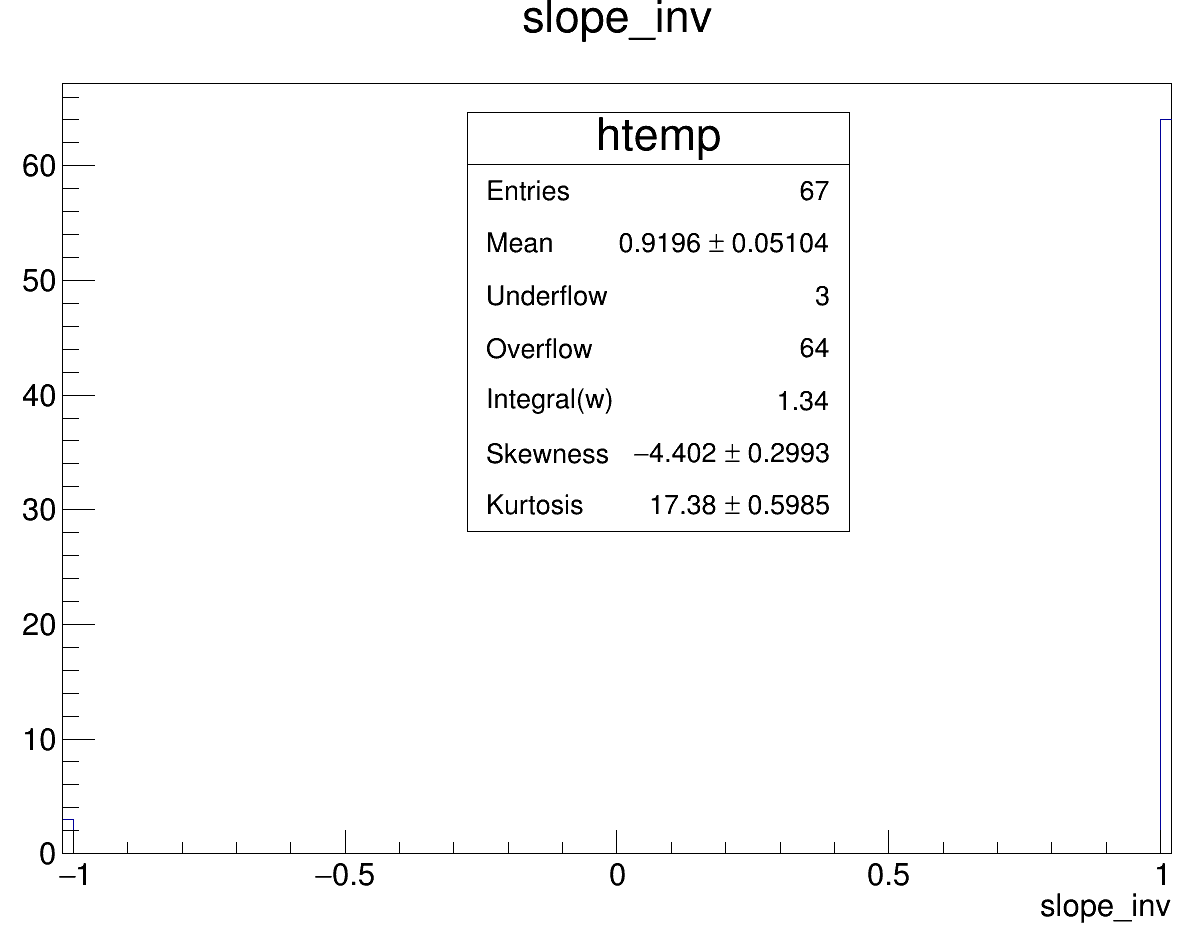
What you shall see:
slope_inv leaf in the new root file snapshot is empty! (extending draw limits show all values at 1.)
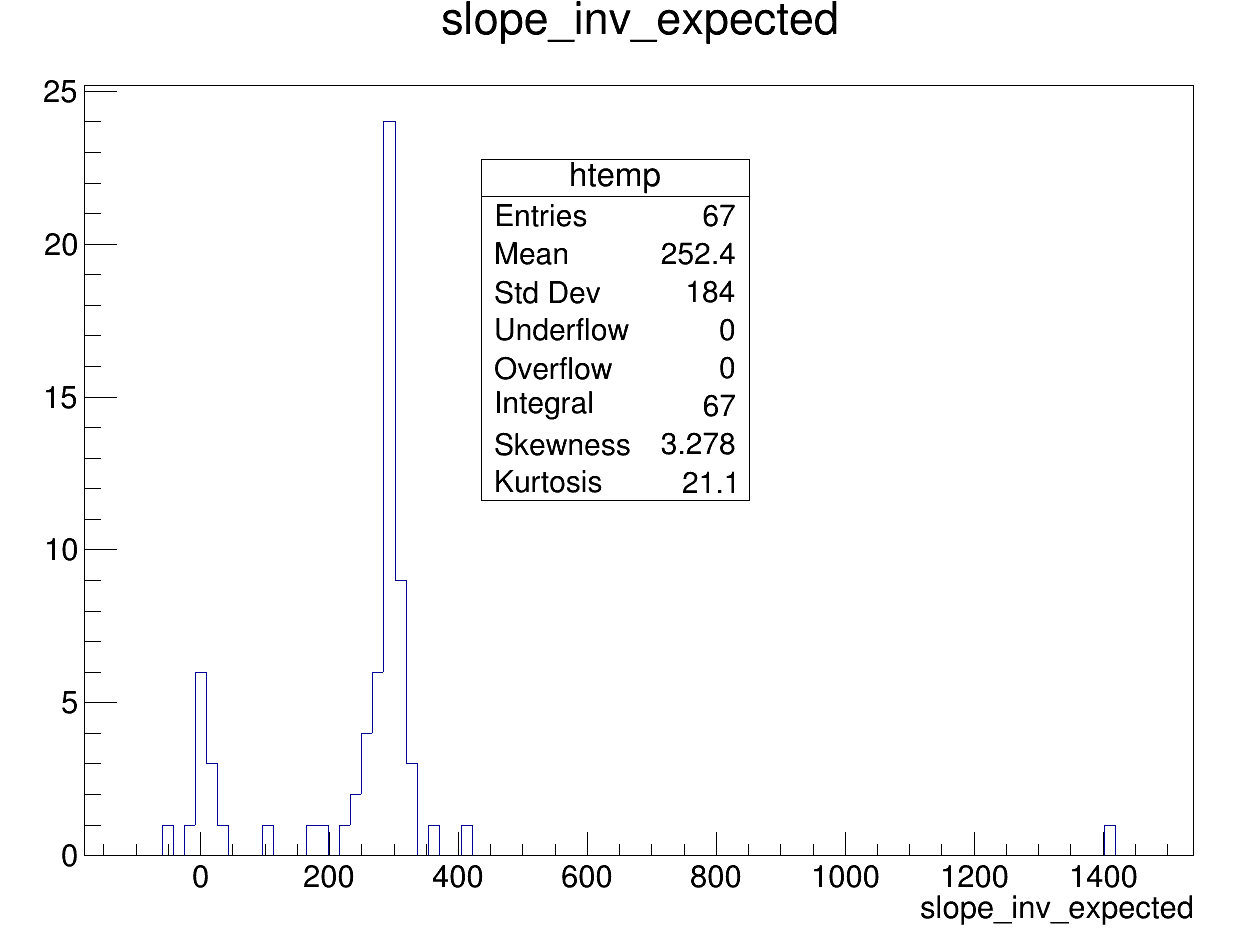
What is expected:
Some values around ~300 region. Because you can see from slope0 and fit std output fit values are fine.

Also, if I make fitFunc() to return inverse parameter in advance, it works! see slope_inv_expected…

What is also puzzling that for 0st parameter everything works fine…

Sorry, I couldn’t make more simple reproducible.

Why this exact peace of code breaks???

Please help… So frustrating :sob: :sob: :sob:…

ROOT Version: 6.22/00
Python: 3.7.6


Hi,
what do you get if you extract the values of slope_inv e.g. as a histogram or with AsNumpy? What if you extract the values of dToImpact, tECALHit and sel_frank and you call fitFunc on them “manually”, are the values sensible in that case?

This should tell us if this is a problem in I/O, Snapshot or fitFunc.

Cheers,
Enrico

  1. h = df.Histo1D("slope_inv") gives expected results :white_check_mark:, BUT it shows few events in under/overflow bins

  1. arr = df.AsNumpy(“slope_inv”) gives expected results, :white_check_mark: but show some infinities

image

but taking inverse inside the function, show all 67 values on the histogram w/o anything in overflow bin… Which I would expect if infinities are really there? (or at least 10^{12} values or something)

P.S. Also, I was wrong saying that variables are “1”. They are just in over/underflow bins which is turned to be 1 because defaul draw range for the leaf is -1 1

===============================================================

So my conclusion would be:

  1. Return of the FitFunc() is being truncated to 0 before 1./FitFunc() inside the Define() is executed resulting in 1./FitFunc() causing infinities, which does NOT happen, executing 1./GetParam inside the function, due to better precision?

  2. If infinities exist Snapshot fails to properly write the branch?
    Values in Histo1D and AsNumpy show expected behaviour (expect few infinities which are caused by bullet 1)

Thanks for investigating.

  1. Shuffling things around might trigger the compiler to produce slightly different code which by chance results in no/less zeros at denominator, I can’t really say. But that’s not really the problem, because:

  2. Snapshot should just be ok with infs, e.g. this works for me: ROOT::RDataFrame(10).Define("x", [] { return 1./0.; }).Snapshot<double>("t", "f.root", {"x"}) and produces a valid ROOT TTree with infs in the branch

I will take a look at this as soon as possible (thank you for sharing a minimal reproducer in the first post).
Cheers,
Enrico

1 Like

Hi,
I ran your reproducer, it wrote out a file called new_test.root, then I checked the contents of the file and everything looks ok:

$ root -l new_test.root
root [0]
Attaching file new_test.root as _file0...
(TFile *) 0x557167e0f0e0
root [1] _file0->ls()
TFile**		new_test.root	
 TFile*		new_test.root	
  KEY: TTree	new_tree;1	new_tree
root [2] new_tree->Print()
******************************************************************************
*Tree    :new_tree  : new_tree                                               *
*Entries :       67 : Total =            5998 bytes  File  Size =       3790 *
*        :          : Tree compression factor =   1.00                       *
******************************************************************************
*Br    0 :tof0      : tof0/D                                                 *
*Entries :       67 : Total  Size=       1100 bytes  File Size  =        611 *
*Baskets :        1 : Basket Size=      32000 bytes  Compression=   1.00     *
*............................................................................*
*Br    1 :tof0_inv  : tof0_inv/D                                             *
*Entries :       67 : Total  Size=       1120 bytes  File Size  =        615 *
*Baskets :        1 : Basket Size=      32000 bytes  Compression=   1.00     *
*............................................................................*
*Br    2 :slope0    : slope0/D                                               *
*Entries :       67 : Total  Size=       1110 bytes  File Size  =        613 *
*Baskets :        1 : Basket Size=      32000 bytes  Compression=   1.00     *
*............................................................................*
*Br    3 :slope_inv : slope_inv/D                                            *
*Entries :       67 : Total  Size=       1125 bytes  File Size  =        616 *
*Baskets :        1 : Basket Size=      32000 bytes  Compression=   1.00     *
*............................................................................*
*Br    4 :slope_inv_expected : slope_inv_expected/D                          *
*Entries :       67 : Total  Size=       1170 bytes  File Size  =        625 *
*Baskets :        1 : Basket Size=      32000 bytes  Compression=   1.00     *
*............................................................................*
root [3] new_tree->Scan()
************************************************************************
*    Row   * tof0.tof0 * tof0_inv. * slope0.sl * slope_inv * slope_inv *
************************************************************************
*        0 * 8.5040693 * 0.1175907 * 0.0033128 * 301.85245 * 301.85245 *
*        1 * 6.8109195 * 0.1468230 * 0.0033688 * 296.83439 * 296.83439 *
*        2 * 6.1392950 * 0.1628851 * 0.0033728 * 296.48112 * 296.48112 *
*        3 * 6.4483658 * 0.1550780 * 0.0033474 * 298.73474 * 298.73474 *
*        4 * 6.2569904 * 0.1598212 * 0.0033593 * 297.67342 * 297.67342 *
*        5 * 6.1932646 * 0.1614657 * 0.0035648 * 280.51536 * 280.51536 *
*        6 * 6.3965694 * 0.1563337 * 0.0033635 * 297.30910 * 297.30910 *
*        7 * 6.4360934 * 0.1553737 * 0.0033067 * 302.40807 * 302.40807 *
*        8 * 6.4505164 * 0.1550263 * 0.0033604 * 297.58130 * 297.58130 *
*        9 * 6.0734381 * 0.1646513 * 0.0034927 * 286.30610 * 286.30610 *
*       10 * 6.3806403 * 0.1567240 * 0.0034268 * 291.81500 * 291.81500 *
*       11 * 6.1570430 * 0.1624156 * 0.0033390 * 299.48672 * 299.48672 *
*       12 * 6.1045896 * 0.1638111 * 0.0033294 * 300.35414 * 300.35414 *
*       13 * 6.2331122 * 0.1604334 * 0.0033640 * 297.26068 * 297.26068 *
*       14 * 6.2409191 * 0.1602328 * 0.0033104 * 302.07078 * 302.07078 *
*       15 * 6.1333004 * 0.1630443 * 0.0033546 * 298.09335 * 298.09335 *
*       16 * 6.1612216 * 0.1623054 * 0.0033349 * 299.85582 * 299.85582 *
*       17 *  6.408068 * 0.1560532 * 0.0033452 * 298.92791 * 298.92791 *
*       18 * 6.9095007 * 0.1447282 * 0.0035584 * 281.02183 * 281.02183 *
*       19 * 6.7891221 * 0.1472944 * 0.0033168 * 301.49521 * 301.49521 *
*       20 * 6.4938696 * 0.1539913 * 0.0038327 * 260.90647 * 260.90647 *
*       21 * 6.6124928 * 0.1512288 * 0.0033268 * 300.58245 * 300.58245 *
*       22 * 7.1201101 * 0.1404472 * 0.0034517 * 289.71154 * 289.71154 *
*       23 * 7.9144653 * 0.1263509 * 0.0033903 * 294.95851 * 294.95851 *
*       24 * 6.8397010 * 0.1462052 * 0.0033215 * 301.06490 * 301.06490 *
Type <CR> to continue or q to quit ==>

If you see an empty histogram when you draw slope_inv it’s probably because some of the values are inf. So what do you mean exactly when you say the slope_inv leaf is empty? Does tree->Scan() not show its contents? I cannot break Snapshot by writing infs in branches (see also my one-liner in the previous post), everything looks ok there.

Cheers,
Enrico

Hi,

ok, then maybe problem is in the TBrowser? What I meant is if you look at the leaf content via TBrowser it draws empty canvas with 64 events in overflow bin and 3 in underflow for slope_inv which does not happen for slope_inv_expected leaf which has the same output, but 0 instead of inf.

And also doesn’t happen for the tof_inv leaf, which has inf

cheers,
Bohdan

Alright, then as far as I can tell it’s “just” a TBrowser quirk. I really can’t tell why TBrowser manages to draw tof_inv but not slope_inv, maybe @bellenot has an idea (or @couet in terms of drawing histograms filled with a couple of infs).

Cheers,
Enrico

1 Like

Infs in histograms should be clearly avoided.

Just an update, @moneta mentioned that infs might be fine, but nans are not (and it’s not a TBrowser issue but a general TH1 issue). So it could be that when drawing tof_inv no calculation leads to nans, while in drawing slop_inv_expected that happens (maybe somewhere in the TH1 internals, e.g. if you use the some of weights in one histogram and not in the other…?).

In any case, infs and TH1s don’t mix very well.

1 Like

This topic was automatically closed 14 days after the last reply. New replies are no longer allowed.