Dear Users,
I am experiencing a strange behavior when drawing a RooHistPdf and comparing it to a TH1 created from the very same RooHistPdf. In the code below, I am using a template histogram to perform a extended likelihood fit of some binned data distribution.
RooRealVar *xl1  = new RooRealVar("xl1","xl1",0.,32.);
RooDataHist *bl1 = new RooDataHist("bl1","bl1",RooArgList(*xl1),Import(*h1_QTrkL1VsR),0);

RooDataHist *hl1  = new RooDataHist("hl1","hl1",RooArgList(*xl1),Import(*templ1));
RooHistPdf *pl1  = new  RooHistPdf("pl1","pl1",RooArgSet(*xl1),*hl1);
RooHistPdf *cl1  = new  RooRealVar("cl1","cl1",inputintl1,0.,h1_QTrkL1VsR->GetEntries());

RooArgSet pl1list;
RooArgSet cl1list;

pl1list.add(*pl1);
cl1list.add(*cl1);

RooAddPdf* pdfl1  = new RooAddPdf("pdfl1","pdfl1",pl1list,cl1list);

double maxposl1 = h1_QTrkL1VsR->GetBinCenter(h1_QTrkL1VsR->GetMaximumBin());
xl1 -> setRange("RintL1",maxposl1-0.3,maxposl1+0.3);
pdfl1 -> fitTo(*bl1,Range("RintL1"),FitOptions("erq"));
After the fitting I draw the fit results using the RooPlot utility but also creating an histogram from the RooHistPdf component and scaling the resulting TH1 appropriately by the fitted coefficient result cl1 -> getVal().
RooPlot *xframel1 = xl1 -> frame(Title("Fit L1"));
bl1 -> plotOn(xframel1,LineColor(1),MarkerSize(0.6),LineWidth(1));
pdfl1 -> plotOn(xframel1,LineColor(2),Range("FULL"),Binning(1280));
pdfl1 -> plotOn(xframel1,LineColor(4),Components("pl1"),Range("FULL"),LineStyle(kDashed));
TH1D *pdrawl1 = (TH1D*)pl1->createHistogram("xl1",1280); // 1280 is the # of bins of templ1 and h1_QTrkL1VsR
pdrawl1 -> Scale(cl1->getVal());
pdrawl1 -> SetLineStyle(1);
pdrawl1 -> SetLineWidth(2);
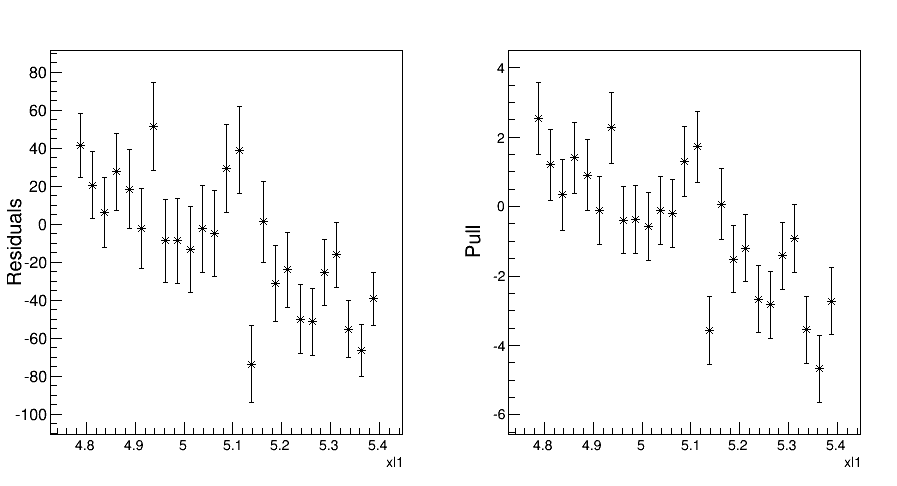
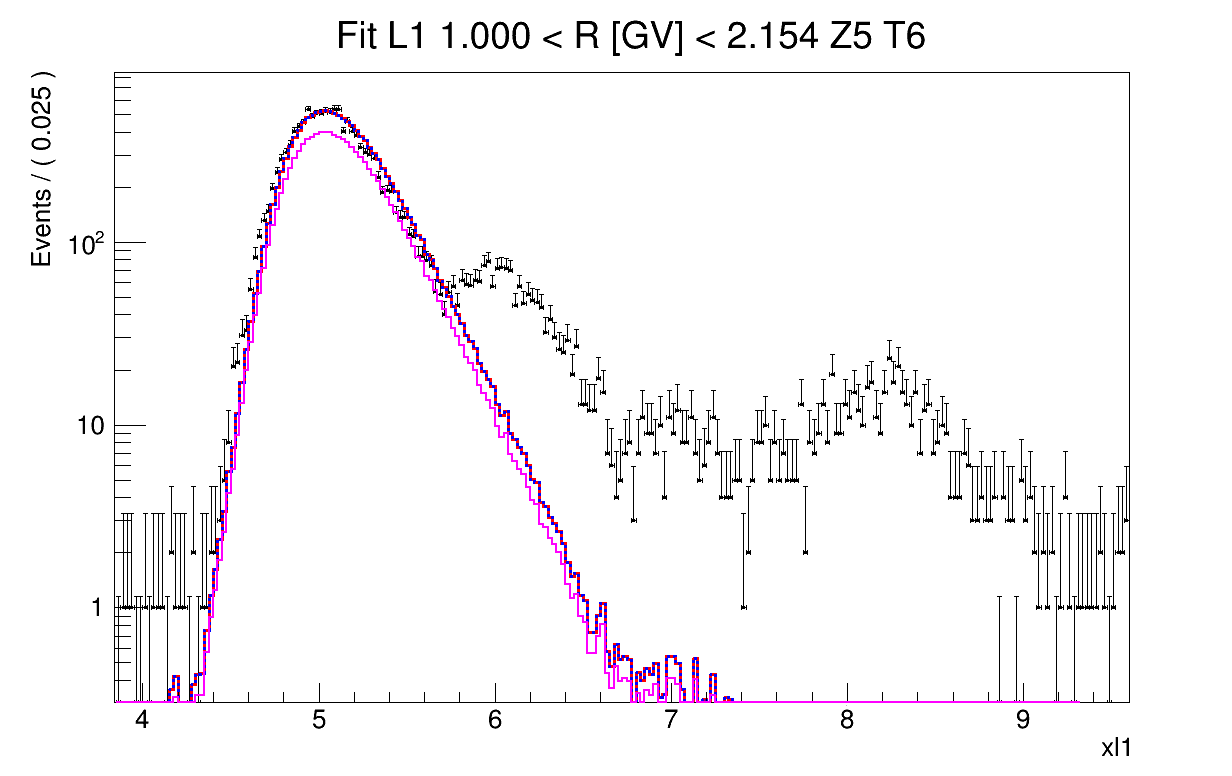
pdrawl1 -> SetLineColor(6);In the attached plot, what I see is that the the blue (RooHistPdf component) and red (RooAddPdf) curves, attributes of the xframel1, follow nicely the data distribution (black), as a result of a rather good fit. But the TH1 object (magenta) is systematically below. I checked the TH1 integration and it is exactly the value of cl1->getVal(),which is obvious since I scaled the TH1 by that value. But clearly, from the drawing, the value of this coefficient is representing correctly either the xframel1 drawing or the TH1. From observation of the pull distribution (attached plot), it seems that the first option is correct (not 100% sure however) but then why is the TH1 drawing wrong? If it were the TH1 representing the correct fit result, then the interpretation as a good fit (at least from simple visual inspection) would be compromised.
Thanks for you help,
Pierre