Hi,
I’d like to draw a histogram with the “bar” option so that the bar width is displayed with the same width when using a logarithmic x axis. Is there a way to achieve this ? So far when having an axis with log scale, the bar width follows the logarithmic aspect-ratio.
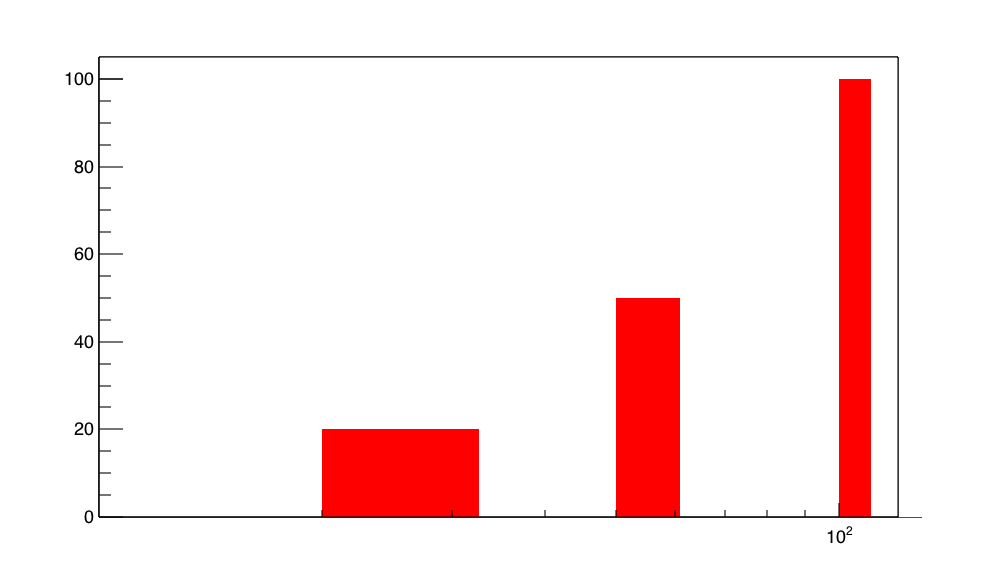
{
  TCanvas *c = new TCanvas("c","c", 1000, 600);
  gPad->SetLogx();

  TH1F *h  = new TH1F("h", NULL, 110, 10, 120);
  h->SetStats(0);
  h->Fill(20,20);
  h->Fill(50,50);
  h->Fill(100,100);
  h->SetFillColor(2);
  h->SetBarWidth(10);
  h->Draw("barhist");
}