I have the following code:
{
  TCanvas *c = new TCanvas("exp vs fit", "exp vs fit",800, 600);
  gStyle->SetOptStat(kFALSE);

  TFile *fe = new TFile("t5ph_e.root");
  TTree *te = (TTree*)fe->Get("t5ph_e");
  int scale_e = te->GetEntries();

//  TFile *fr = new TFile("inma_r.root");
//  TTree *tr = (TTree*)fr->Get("in_ma");

  TFile *fs = new TFile("t5ph_s.root");
  TTree *ts = (TTree*)fs->Get("t5ph_s");
  int scale_s = ts->GetEntries();


  TH1F *e_data = new TH1F("e_data", "e_data",1e2,0,2e3);
  te->Project("e_data", "phen_e");
  //e_data->Scale(1./scale_e);

  TH1F *s_data = new TH1F("s_data", "s_data",1e2,0,2e3);
  ts->Project("s_data", "phen_s");
  //s_data->Scale(1./scale_s);
  s_data->SetLineColor(kRed);
//  TH1F *r_data = new TH1F("r_data", "r_data",1e2,0,2e3);
//  tr->Project("r_data", "omega_r**.5");
//  r_data->SetLineColor(kRed);

  e_data->Draw();
  s_data->Draw("same");
//  r_data->Draw("same");

  ////c->->SetLogy();
  c->BuildLegend();
}
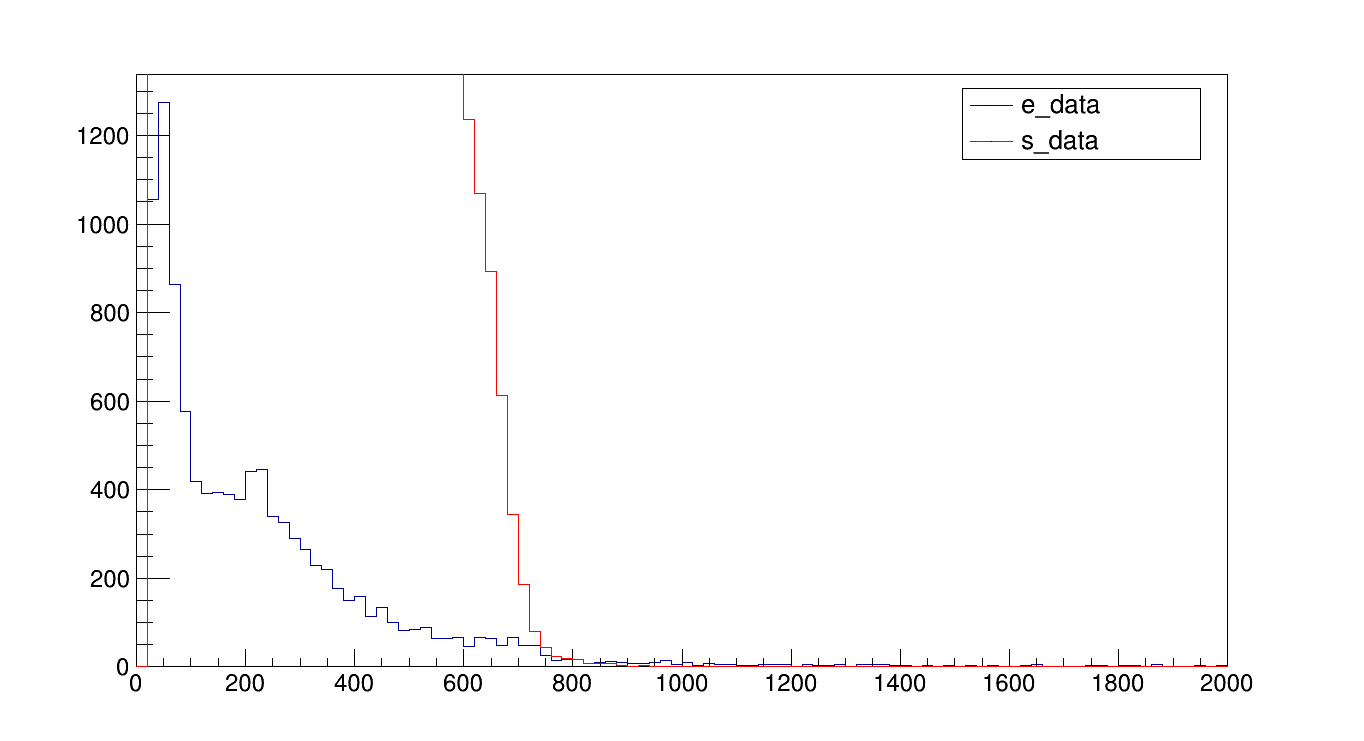
And this what I get
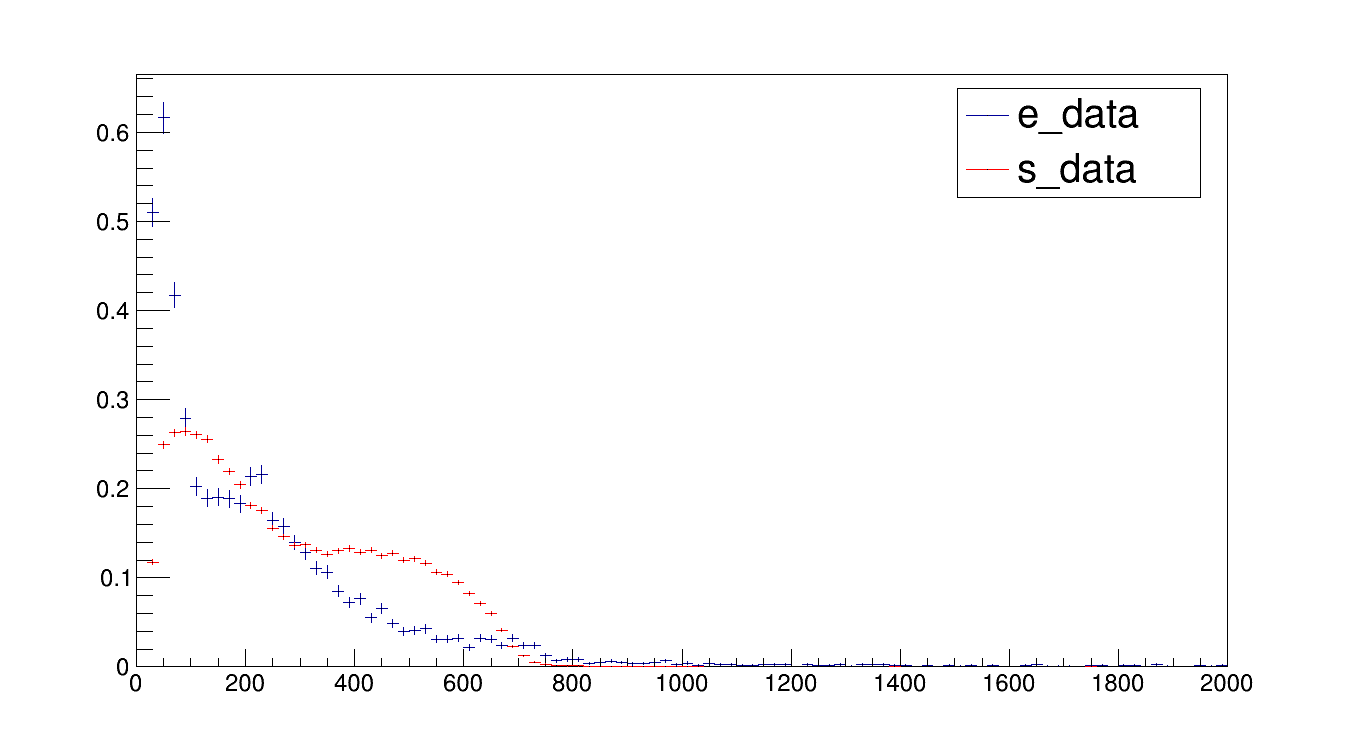
But if I uncomment the scale lines I get this
Why ROOT changes the drawing style?