I have something that might help,
my original code snippet with the issues, described in my question, looked like this:
//loading a **root** file with **tree** name **Board** that has a double variable named **t_day** that contains the **time** info in **days**, it has another variable named **adc**

t1 = 0; //days
t2 = 31; //days
int tBin = (t2-t1)*24*60/10; //every 10 minutes (units of days)
double dt = 10./(60.*24.);  //bin width (10 minutes in days)

TProfile *prof = new TProfile("prof","prof", tBin, t1, t2);

for(int i = 0; i < tBin; i++)
{
    Time = t1 + i*dt;

    TH1F *h = new TH1F("h", "h", 100, 0, 100);

    Board->Draw("adc>>h", Form("t_day >= %g && t_day < %g", Time, Time + dt));
    //I fit this histogram "h" and extract a parameter say "mean_h" and fill it to the TProfile "prof"

    prof->Fill(Time + dt/2., mean_h);
}

prof->Draw("e1");
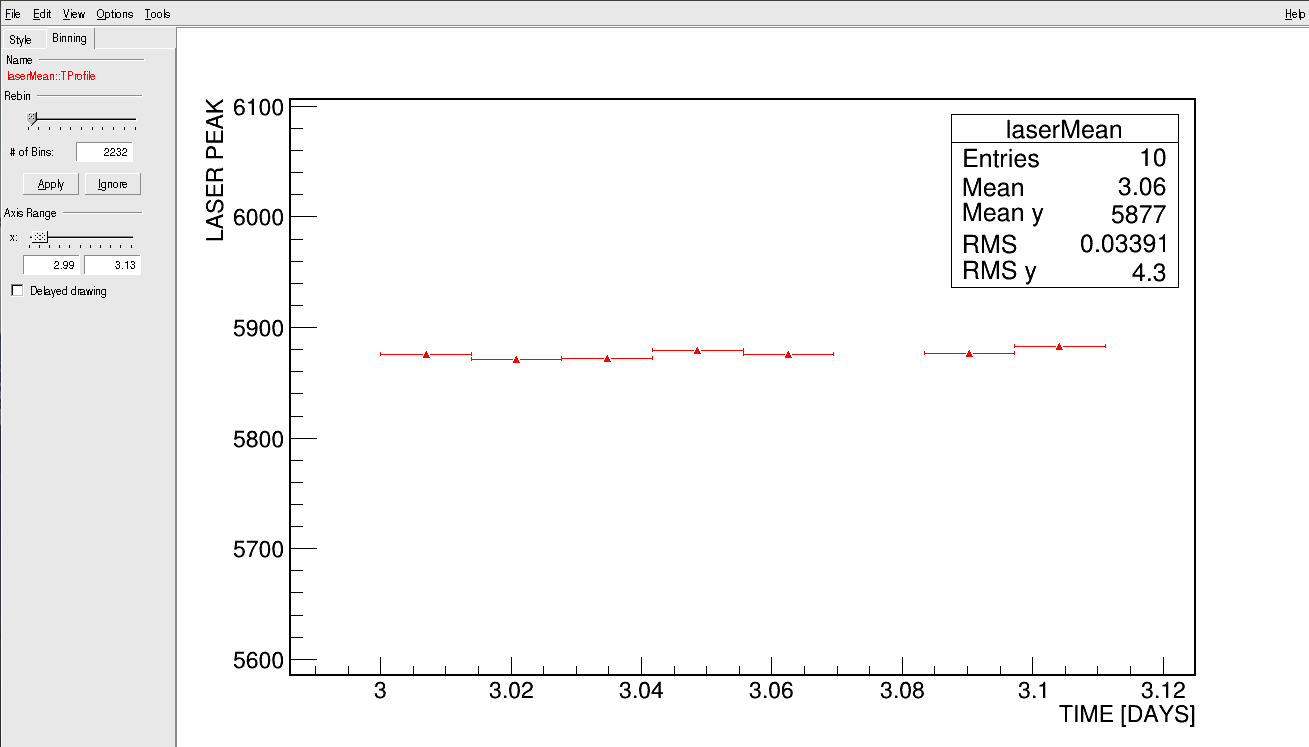
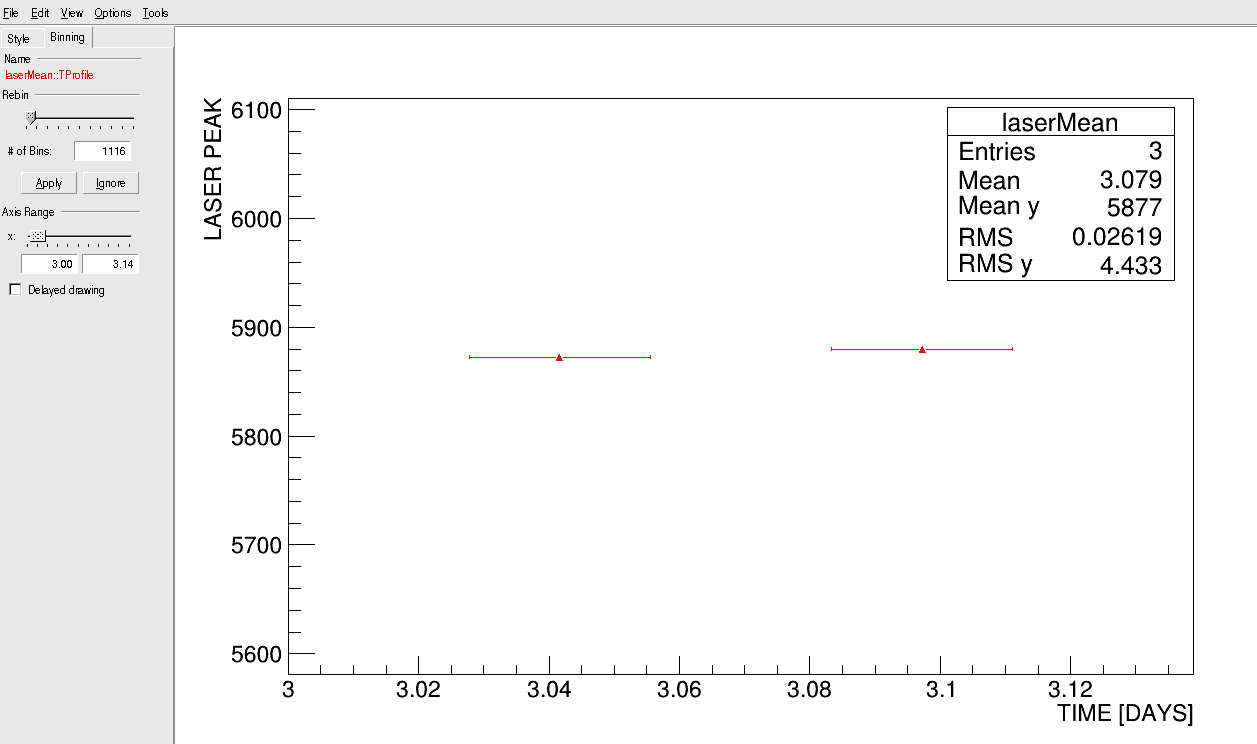
Then I changed the variable “Time” that I was feeding to the TProfile, instead of filling Time + dt/2. I filled just Time and my problem was gone! Nice TProfile with separated points 
The questions naturally arises:
I am checking if the time variable of the root file, that is t_day is within my external loop time window, which is Time = t1 + i * dt and Time + 10 minutes, then using that piece of data. But while filling, of course I want to use the mean value of this time: Time + dt/2. to fill my TProfile prof, why can’t I do that? Why the lower edge that is Time works and gives me nice TProfile with separated points but becomes strange histogram looking bar diagram when I fill the mid value Time + dt/2. ?
My Guess:
Suppose my definition was:
TProfile *prof = new TProfile("prof","prof", 5, 0, 5);
In such a case, by definition, on the X-axis I have time bins:
0, 1, 2, 3, 4, 5,
but I am filling the values
0.5, 1.5, 2.5, 3.5, 4.5
instead.
If ROOT Tprofiles was saving values at the middle of a bin then there shouldn’t have been any problem, but my guess is that it saves values at the beginning of the bin and not in the middle, therefore 0.5 was allocated to the value 0, 1.5 to 1 and so on… can this root behavior be the root cause of my problem?
VERY IMPORTANT EDIT
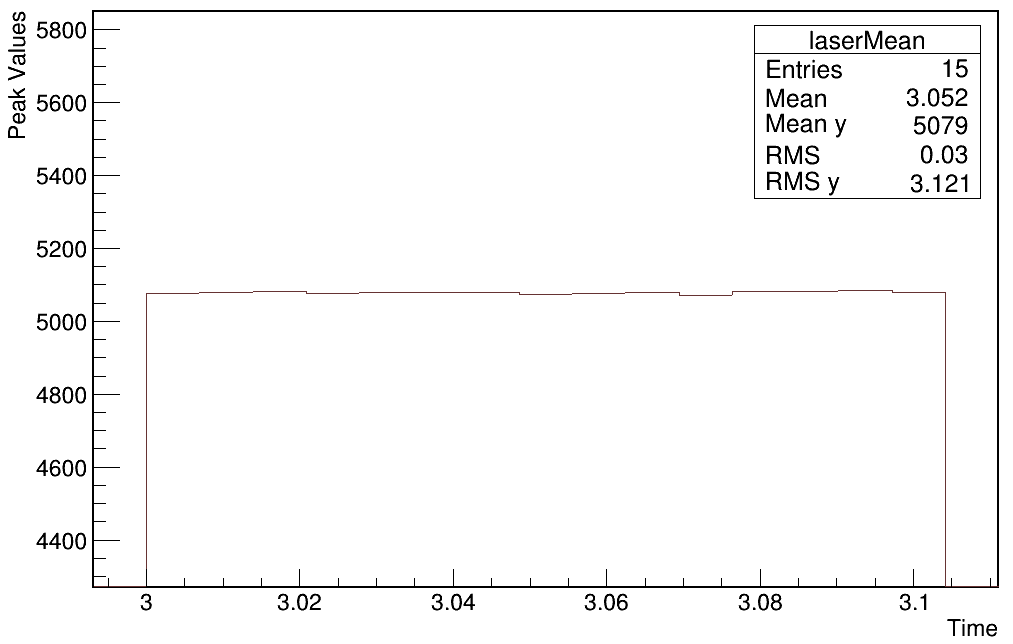
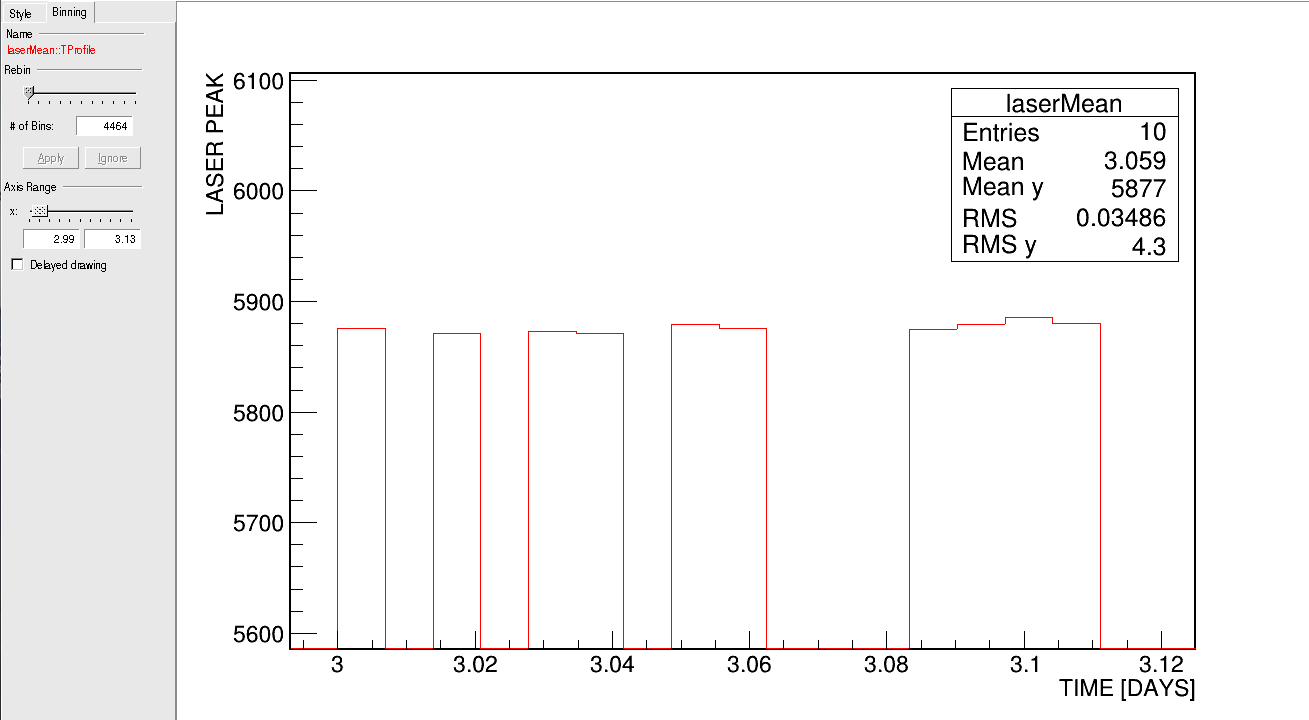
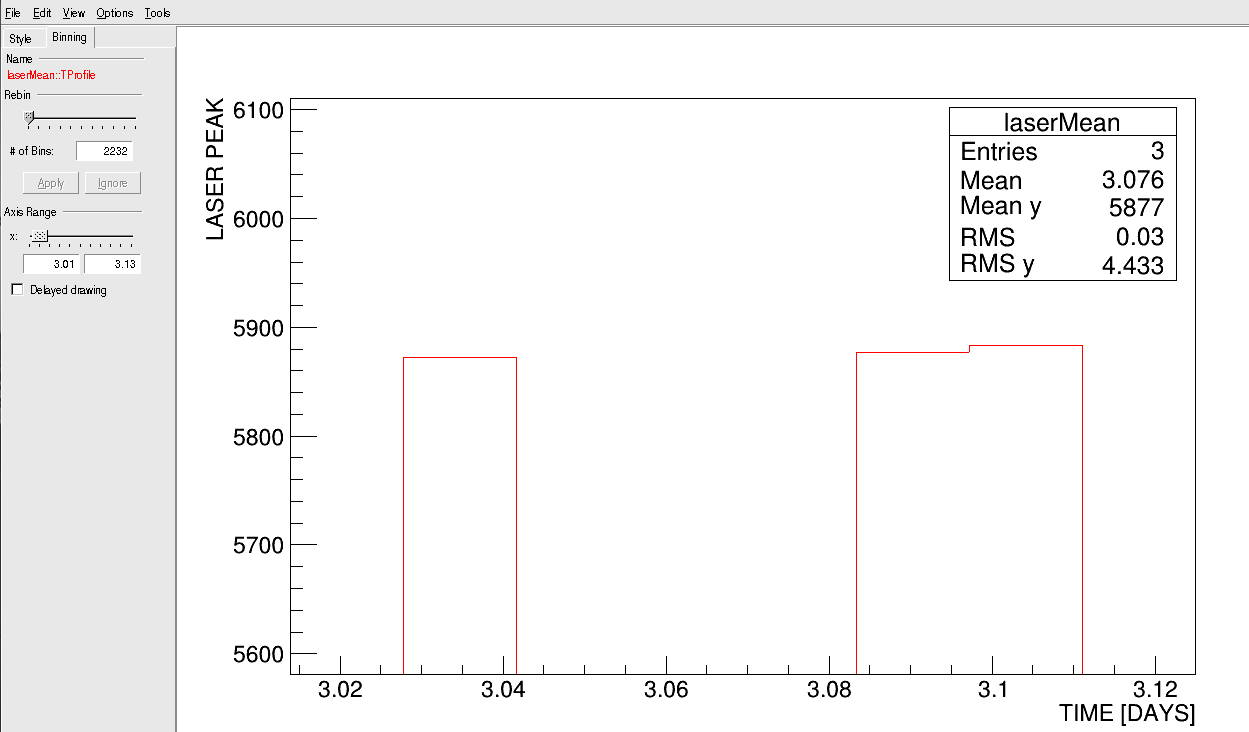
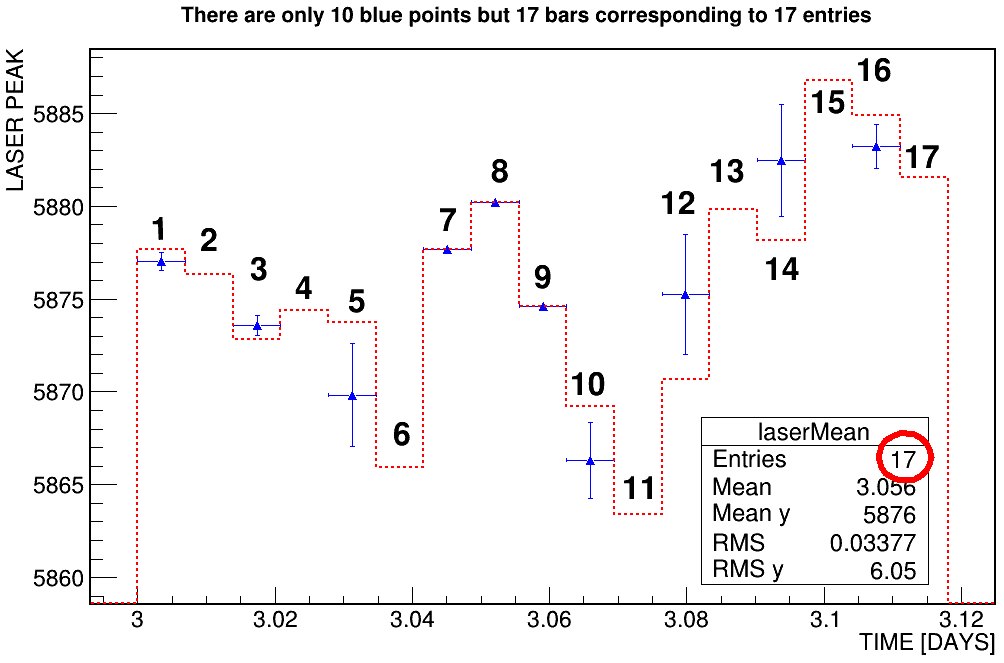
When the TProfile looked like TH1F with bars, it was more correct, in the sense that each bins had right values and there were as many bars (with different values) as there were number of entries, but when I changed the fill variable from Time + dt/2. to just Time, bar problem got solved and I got nice TProfile with separated points, but some of the points got dumped in single bins, as a result, there were less points than actual number of entries/fills! In my case there were 10 points for 17 entries. I checked that, those specific bin contents were actually the sum of two entries! This is very weird!!! I don’t know what’s going on! Please advise.
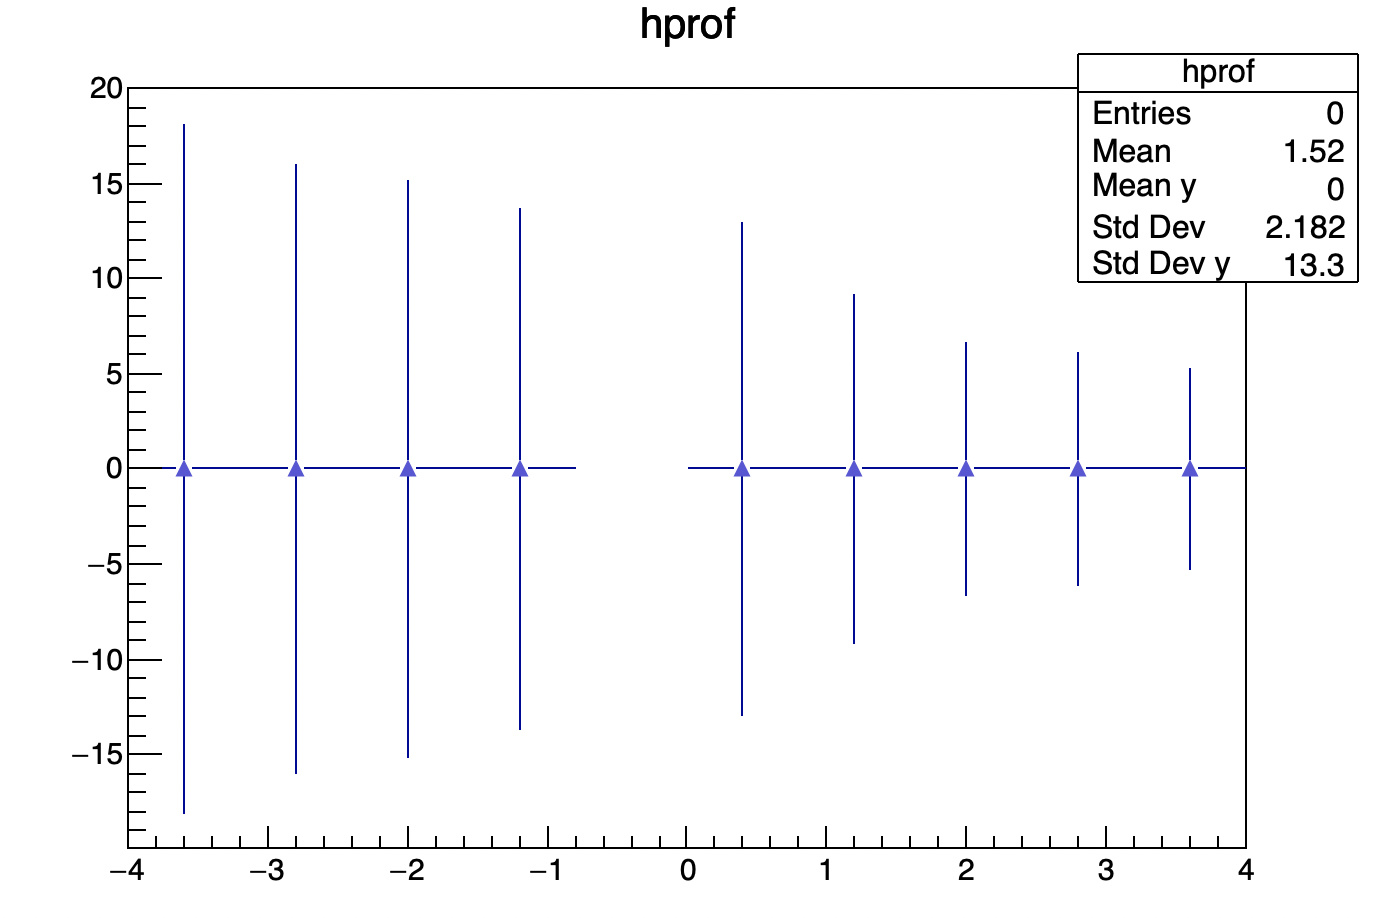
Check out the figure below where I plot using both methods that illustrates the issue:
Blue triangle plot is produced by filling Time in the x-axis and bar profile is when I fill Time + dt/2.