Hello, I have plotted the cdf of the poisson distribution in different ways for different parameter lambda.
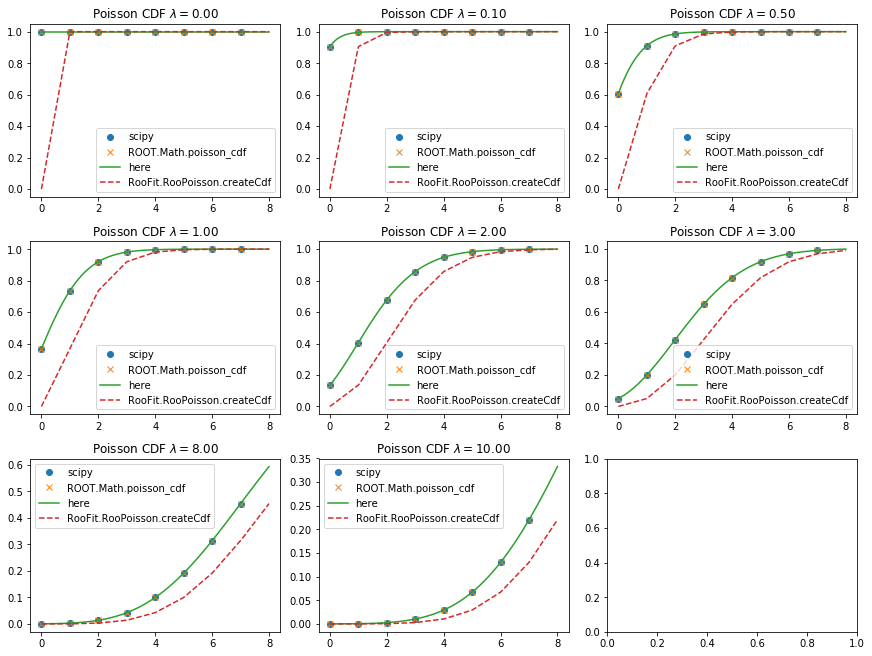
As you can see all of them agrees, but the one made with RooPoisson.createCDF seems to be shifted by 1. Is there a reason?
In case you need the code to reproduce:
from matplotlib import pyplot as plt
from scipy import stats
import numpy as np
import ROOT


def poisson_cdf(l, n):
    return 1 - stats.gamma(n + 1).cdf(l)

NEXAMPLES = (0, 0.1, 0.5, 1, 2, 3, 8, 10)
fig, axs = plt.subplots(len(NEXAMPLES) / 3 + 1, 3, figsize=(12, 9), constrained_layout=True)
xspace = np.linspace(0, 8, 200)
xspace_int = np.arange(0, 8)

for nexample, ax in zip(NEXAMPLES, axs.flat):
    xvar = ROOT.RooRealVar('xvar', 'xvar', -10, 100)
    root_poisson = ROOT.RooPoisson('roopoisson', 'roopoisson', xvar, ROOT.RooFit.RooConst(nexample))
    root_poisson_cdf = root_poisson.createCdf(ROOT.RooArgSet(xvar))
    root_poisson_cdf_f = root_poisson_cdf.asTF(ROOT.RooArgList(xvar))

    ax.plot(xspace_int, stats.poisson(nexample).cdf(xspace_int), 'o', label='scipy')
    ax.plot(xspace_int, map(lambda x: ROOT.Math.poisson_cdf(x, nexample), xspace_int), 'x', label='ROOT.Math.poisson_cdf')
    ax.plot(xspace, poisson_cdf(nexample, xspace), label='here')
    ax.plot(xspace, map(root_poisson_cdf_f.Eval, xspace), '--', label='RooFit.RooPoisson.createCdf')
    ax.legend(loc=0)
    ax.set_title("Poisson CDF $\lambda = %.2f$" % nexample)
fig.savefig('poisson_cdf.png', bbox_inches='tight')