Hi,everyone.
I just would like to make a 3D plot with the TGraph2D class ,But some points, which I have set in the code, could not be showed in the figure
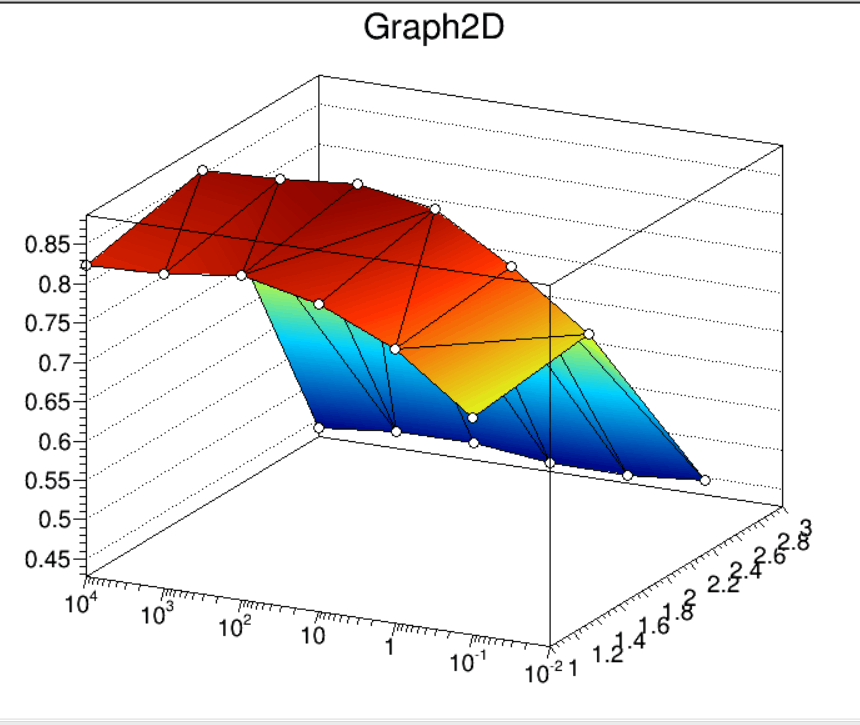
My code is just below.
Tgraph2D()
{
TCanvas *c = new TCanvas("c","Graph2D example",0,0,700,600);
TGraph2D *dt = new TGraph2D();

dt->SetPoint(0,1.00,  10000.000,  0.823005698006);
dt->SetPoint(1,1.00,  1000.000,  0.826745014245);
dt->SetPoint(2,1.00,  100.000,  0.841168091168);
dt->SetPoint(3,1.00,  10.000,  0.818554131054);
dt->SetPoint(4,1.00,  1.000,  0.777065527066);
dt->SetPoint(5,1.00,  0.100,  0.704415954416);
dt->SetPoint(6,1.00,  0.01, 0.623753561254);

dt->SetPoint(7,2.00,  10000.000,  0.855056980057);
dt->SetPoint(8,2.00,  1000.000,   0.858796296296);
dt->SetPoint(9,2.00,  100.000,    0.867699430199);
dt->SetPoint(10,2.00,  10.000,     0.850249287749);
dt->SetPoint(11,2.00,  1.000,      0.792556980057);
dt->SetPoint(12,2.00,  0.100,      0.721688034188);
dt->SetPoint(13,2.00,  0.01, 0.657229344729);

dt->SetPoint(14,3.00,  10000.000,  0.438746438746);
dt->SetPoint(15,3.00,  1000.000,  0.448183760684);
dt->SetPoint(16,3.00,  100.000,  0.448896011396);
dt->SetPoint(17,3.00,  10.000,  0.439102564103);
dt->SetPoint(18,3.00,  1.000,  0.43839031339);
dt->SetPoint(19,3.00,  0.100,  0.446403133903);
dt->SetPoint(20,3.00,  0.01,  0.436787749288);

gStyle->SetPalette(55);
dt->Draw("tri1 p0");
 }
and when I execute: root -l Tgraph2D.C and SetlogY for the figure, the three points,number 6,13,20, whose y value are 0.01 disappear from the figure
dt->SetPoint(6,1.00,  0.01, 0.623753561254);
dt->SetPoint(13,2.00,  0.01, 0.657229344729);
dt->SetPoint(20,3.00,  0.01,  0.436787749288);
I do not quite know why this strange thing happen
And sincerely hope anyone who understands this bug could provide some solutions.thanks!!!